Splunk is a popular unified security and observability platform used by businesses and MSSPs to detect, investigate, and respond to potential security threats. Today, many enterprises use it as their preferred Security Information and Event Management (SIEM) solution.
In this guide, I am going to show you how Splunk Enterprise and Zenarmor can easily be integrated, giving MSSPs and businesses an easy starting point to ingest Zenarmor event log data into Splunk Enterprise.
Grab your favorite caffeinated beverage, and let’s get started.
Splunk installation and app setup
For this guide, I spun up a fresh copy of Ubuntu Server 22.04 and installed Splunk Enterprise 9.1.1 as per the Splunk documentation. The Splunk documentation covers the step-by-step process, and to keep this guide as succinct as possible, I have chosen to omit the setup process. I assume from here on that you already have a working instance of Splunk Enterprise running in your environment. Splunk can run on Linux, MacOS, and Windows, so you are spoilt for choice as to how you would like to deploy this powerful SIEM platform.
Now that your Splunk Enterprise deployment is online, we need to create a custom Zenarmor app using the Splunk dashboard. The main reason I chose to do this is so that we can compartmentalize all the settings, indexes, permissions, etc. under one app. However, this is not necessarily needed; I just think doing this makes things easier to manage and has a more polished outcome.
Creating the custom Zenarmor app within Splunk Enterprise is straightforward. After you have logged in, on the extreme left, you will see an “Apps” menu with a few preloaded apps. You will see a “manage” button. Click on it, and it will show you a more comprehensive list of all the apps included in your Splunk deployment. Click on the “Create App” button in the top right corner and fill out the required information as seen below:
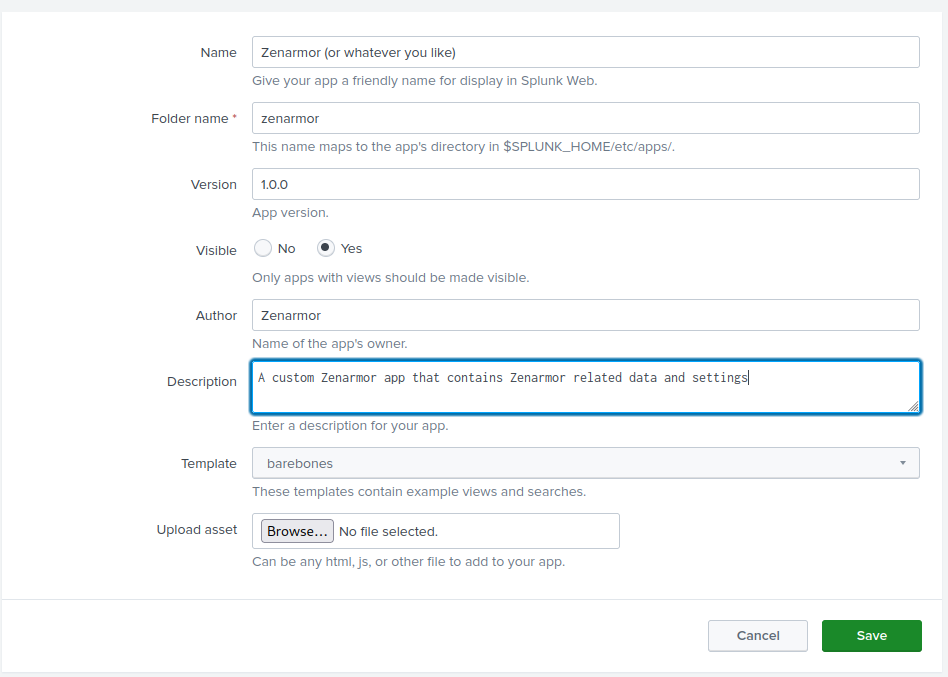
Figure 1: Form to set up your custom Splunk app
Once done, click “Save” and your app will be created. You will see your new app appear under the “Apps” menu on the main dashboard. The newly created app as it stands is not really doing anything useful at this stage, so the next step of the process is creating some indexes for our app and then streaming Zenarmor syslog event data to the Splunk indexer using Splunk Connect for Syslog, abbreviated as SC4S.
Splunk Connect for Syslog (SC4S) setup and connecting to Splunk Enterprise
Just a quick intro to Splunk Connect for Syslog (SC4S). It’s basically an open-source solution based on Syslog-ng and other packages to get syslog data into Splunk using Splunk’s HTTP Event Collection (HEC) protocol without the need for universal forwarders.
It was designed to be scalable and quick to deploy using Docker or K8s, offering filtering and parsing capabilities to quickly get formatted and enriched syslog data into Splunk. It is currently well supported by Splunk and is considered a best practice when sending syslog event data to Splunk. Because it uses HEC, which basically sends data to Splunk via HTTP, it can be used with a load balancer to create a high-performance, scalable, and robust solution to stream syslog event data to multiple Splunk indexers. It also has the ability to archive data so that, in the event the connection to the Splunk indexers is severed, you won’t lose any precious log data.
A typical enterprise deployment of SC4S may look similar to the image below, where SC4S collects multiple streams of syslog event data from different devices, filters and parses the data, and sends it to an upstream load balancer via HEC, where it’s forwarded to the Splunk indexers.
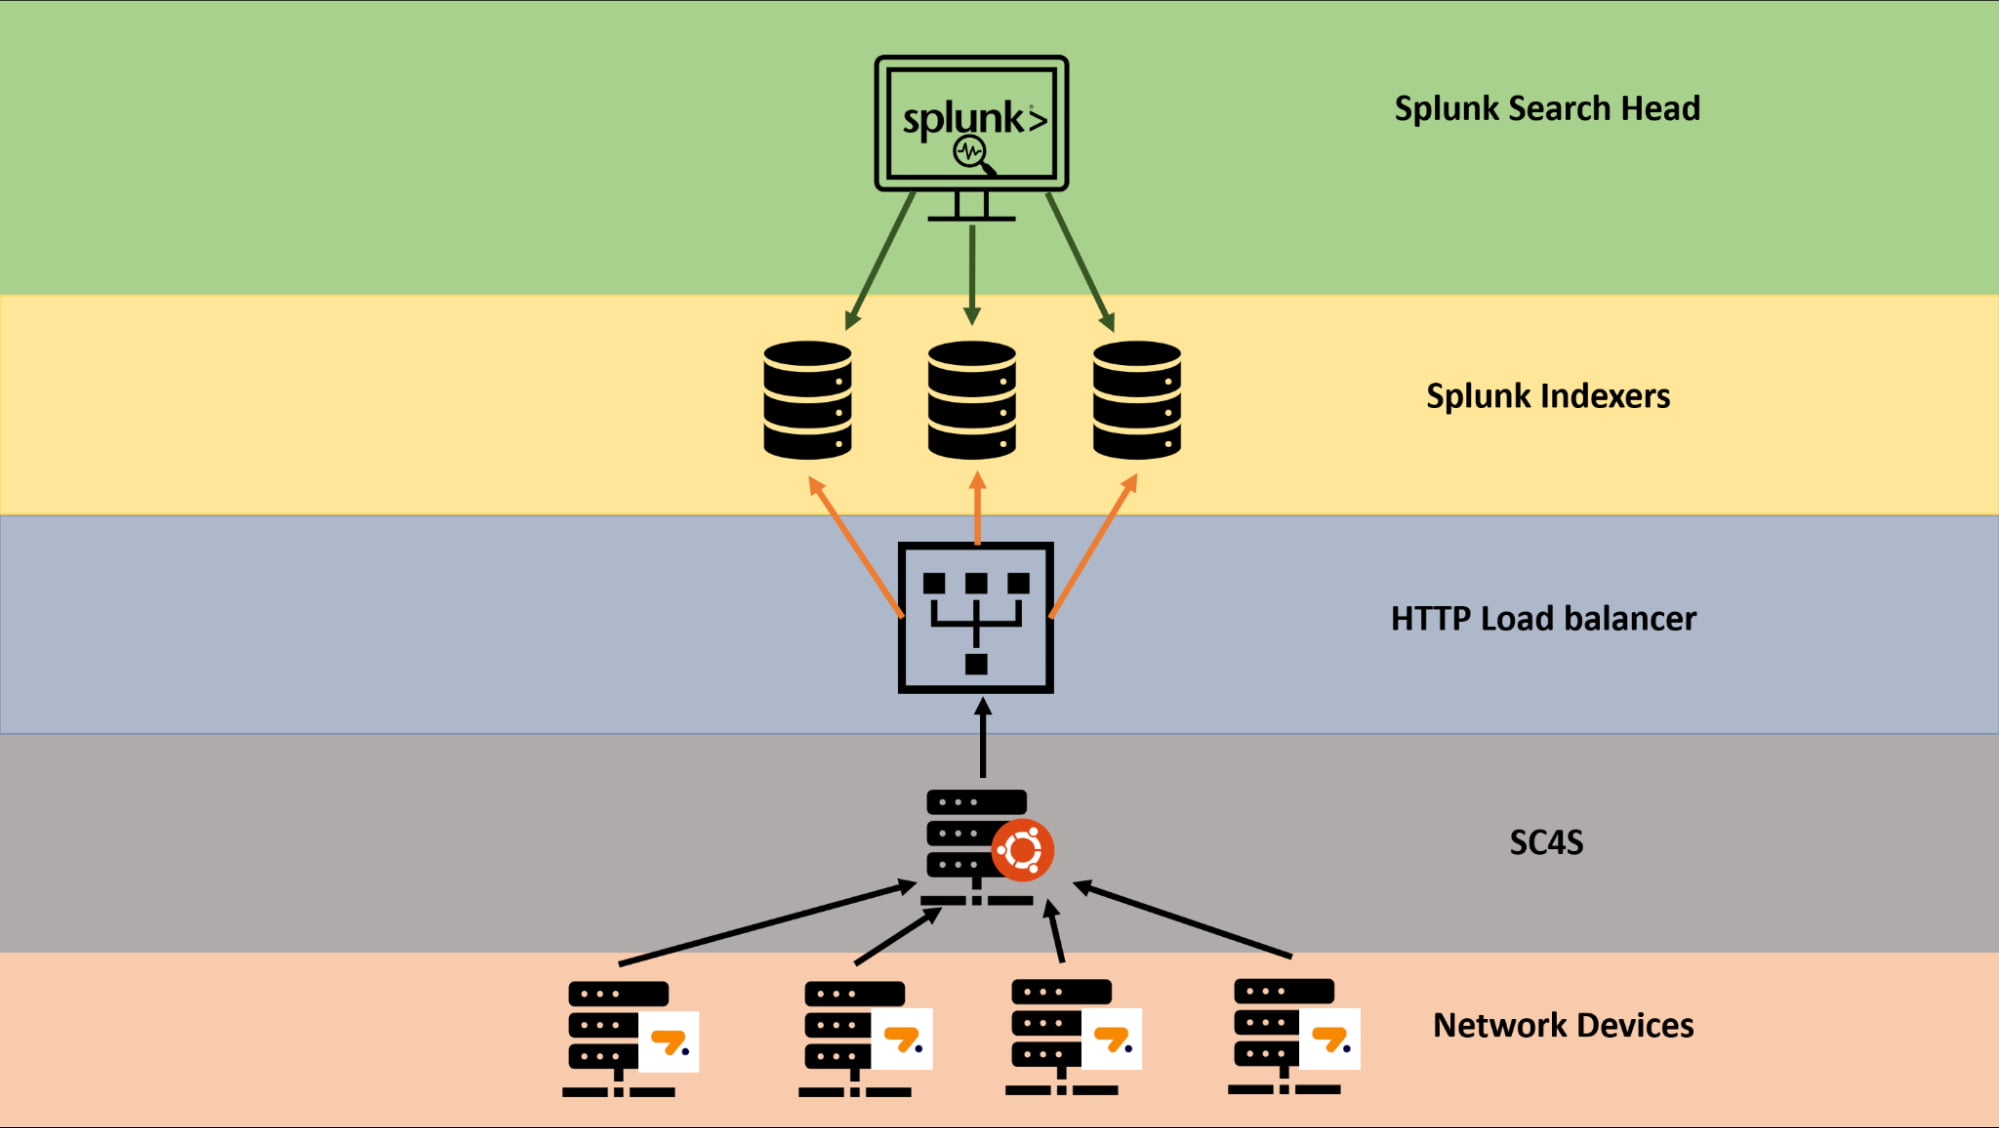
Figure 2: Example of enterprise SC4S deployment
For this demonstration, I have slimmed down the architecture a bit to keep things simple and to the point. The load balancer has been totally omitted, and Splunk’s indexer and search head reside on the same server. SC4S has been deployed on its own Ubuntu 22.04 server using docker and docker-compose and finally, we have Zenarmor 1.15 running on an OPNsense firewall, streaming syslog event data to our SC4S instance as seen in the diagram below.
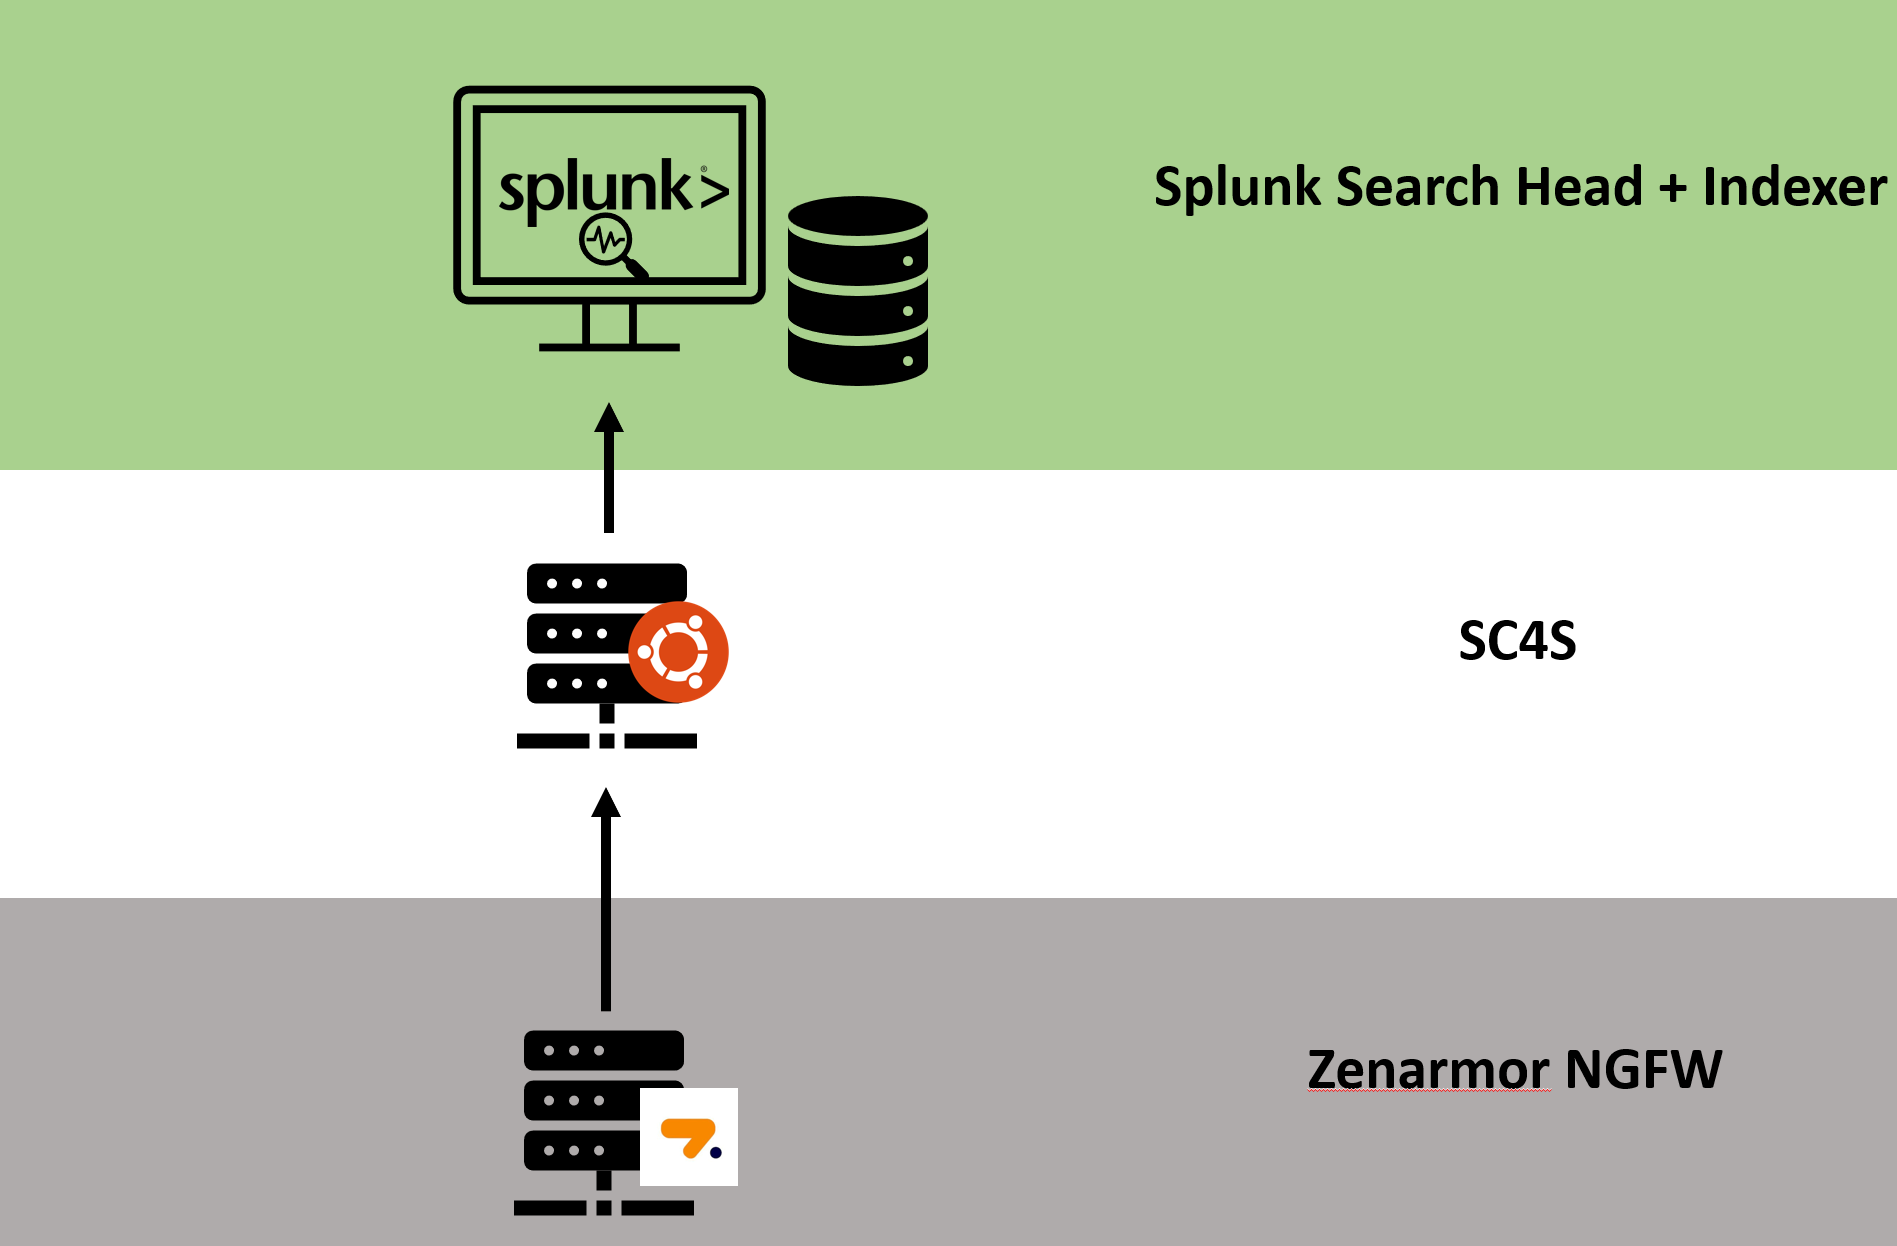
Figure 3: Slimmed-down architecture used in this guide
Like in the case of the Splunk Enterprise installation, I am not going to do a full step-by-step process because this process is already well documented here, however, here is a quick summary of the process I followed.
- I created the default SC4S indexes as described in the linked documentation. This is easily achieved by going to Settings-> Indexes in the Splunk dashboard and clicking the “New Index” button and filling out the form, most of which is optional.
While you are doing this, also create a zen_conns index that we will use later in the guide to store Zenarmor-specific data.
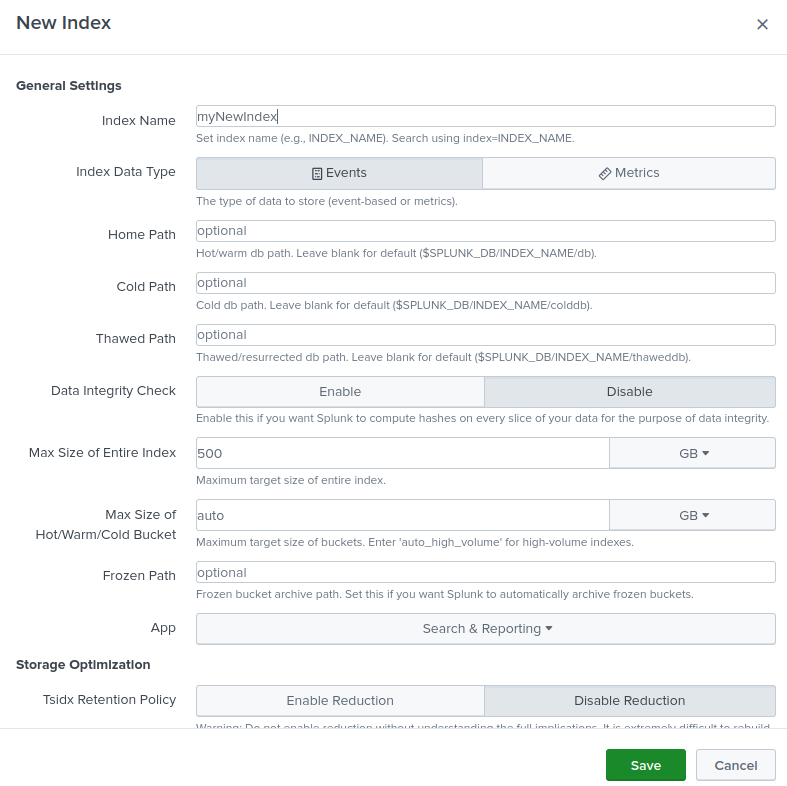
Figure 4: Index creation process
- An HEC token needs to be created for SC4S; to do this once again, go to Settings->Data Inputs in your Splunk dashboard and add a new HTTP Event Collector (HEC). Splunk will prompt you for a series of inputs. On the first “select source” page, give your HEC token a name, and don’t select “enable indexer acknowledgment”.
On the “input settings” page, leave the source type as automatic, and select all the default indexes created in the previous step as allowed, as well as the zen_conns index. Set the default index to zen_conns for now, and click the review button followed by the submit button.
If all went well, you will now see your newly created HEC token, as seen in the image below. Save this value because we will need it in the following steps.

Figure 5: HEC token created in the previous step
- Create a docker-compose.yml file and use the following configuration as per the documentation:
version: "3.7"
 services:
     sc4s:
         deploy:
         replicas: 1
         restart_policy:
             condition: on-failure
         image: ghcr.io/splunk/splunk-connect-for-syslog/container2:2
         ports:
         - target: 514
             published: 514
             protocol: tcp
         - target: 514
             published: 514
             protocol: udp
         - target: 601
             published: 601
             protocol: tcp
         - target: 6514
             published: 6514
             protocol: tcp
         env_file:
         - /opt/sc4s/env_file
         volumes:
         - /opt/sc4s/local:/etc/syslog-ng/conf.d/local:z
         - splunk-sc4s-var:/var/lib/syslog-ng
     # Uncomment the following line if local disk archiving is desired
     #     - /opt/sc4s/archive:/var/lib/syslog-ng/archive:z
     # Map location of TLS custom TLS
     #     - /opt/sc4s/tls:/etc/syslog-ng/tls:z
 volumes:
splunk-sc4s-var:- You will then need to setup your environment variables by creating an env_file in /opt/sc4s and populating it with the following:
 #Point to Splunk on port 8088
 SC4S_DEST_SPLUNK_HEC_DEFAULT_URL=https://192.168.1.106:8088

 #HEC Token created in the previous step
 SC4S_DEST_SPLUNK_HEC_DEFAULT_TOKEN=7a8d5668-e5b5-444a-a255-8d78d99c40b4

 #Uncomment the following line if using untrusted SSL certificates
 SC4S_DEST_SPLUNK_HEC_DEFAULT_TLS_VERIFY=no

 #Define a custom listening port for Zenarmor (we will use this later in the setup)
SC4S_LISTEN_ZENARMOR_UDP_PORT=514- If all was configured correctly after running docker-compose you should see a similar output, SC4S is now listening for syslog connections:

Figure 6: After running docker-compose you should see the “HEC connection test successful” like in the image above
Activating Syslog in Zenarmor and streaming the data to SC4S
In order for Zenarmor to stream its syslog event data to SC4S, we need to enable this using the Zenarmor dashboard under Settings->Data Management.
You will need to point Zenarmor to your SC4S instance, in my case, SC4S is at 192.168.1.107 using UDP port 514 you can also use TCP if you prefer. I have chosen to send all connection data to SC4S, however, you can also select Web, DNS, TLS and Alert specific data if you wish. Once configured, click the “Update” button, and Zenarmor will start streaming log data to SC4S.
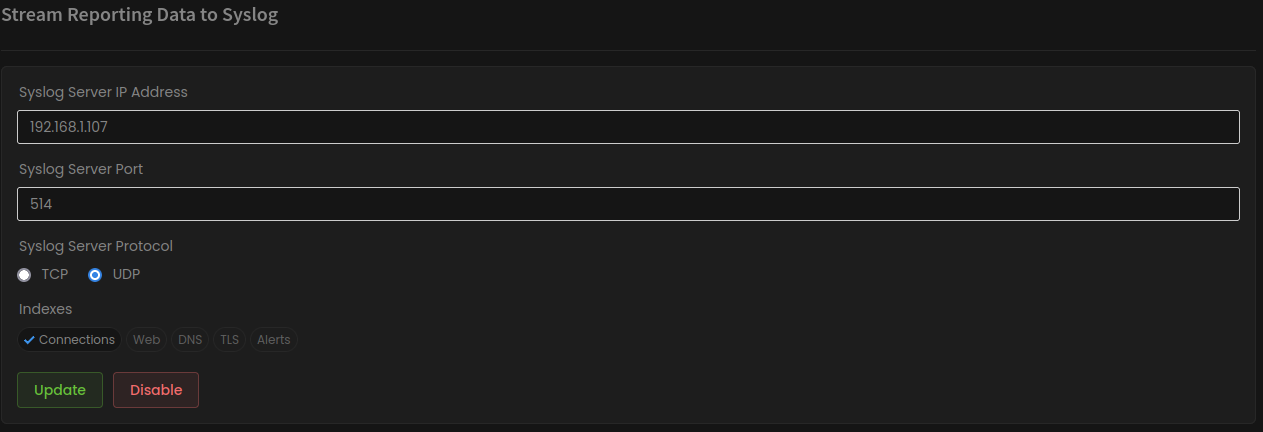
Figure 7: Zenarmor syslog configuration
Observing the data in Splunk and how we can improve our Syslog collection
At this stage, you should start seeing Zenarmor syslog events streaming into Splunk, which is great. However, there is still room for improvement, as the result is not quite ideal.
Firstly, you will notice that SC4S has added the syslog events to the “osnix” index and not the “zen_conns” index we created earlier. This is because SC4S matches the log message against its known Linux/Unix syslog pattern, which results in the source type being set to nix:syslog which is not really what is desired. We need a Zenarmor-specific source type for the data to be stored in the correct index.
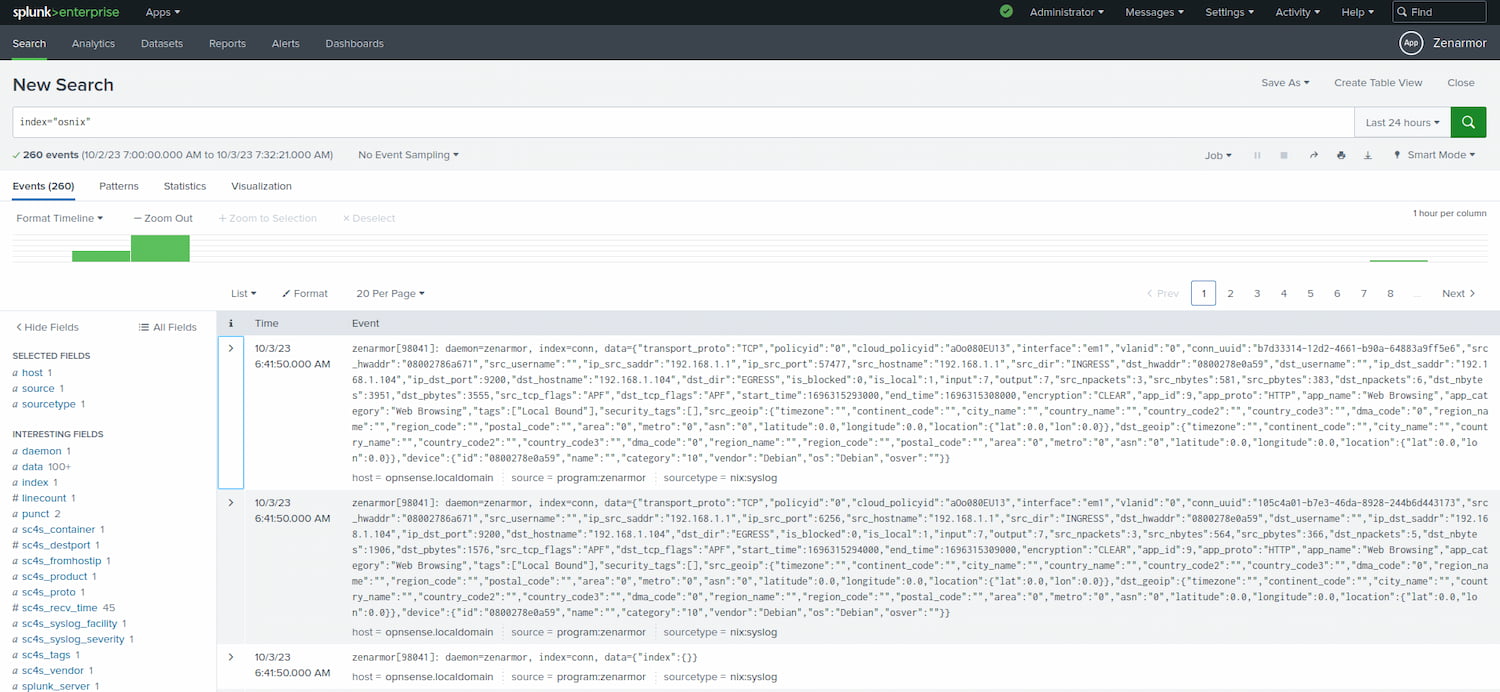
Figure 8: Zenarmor syslog data in the osnix index notice the incorrect index and sourcetype
Secondly, you will notice that because SC4S does not totally understand the Zenarmor syslog event, it does not know what to do with all the data sent from Zenarmor that has been formatted using JSON. As a result, all the useful Zenarmor data is assigned to one data field in Splunk, which is not ideal because we can’t easily search or use this data to create dashboards, etc. So we need a means to extract the JSON-formatted data and assign each bit of data to its own unique field.
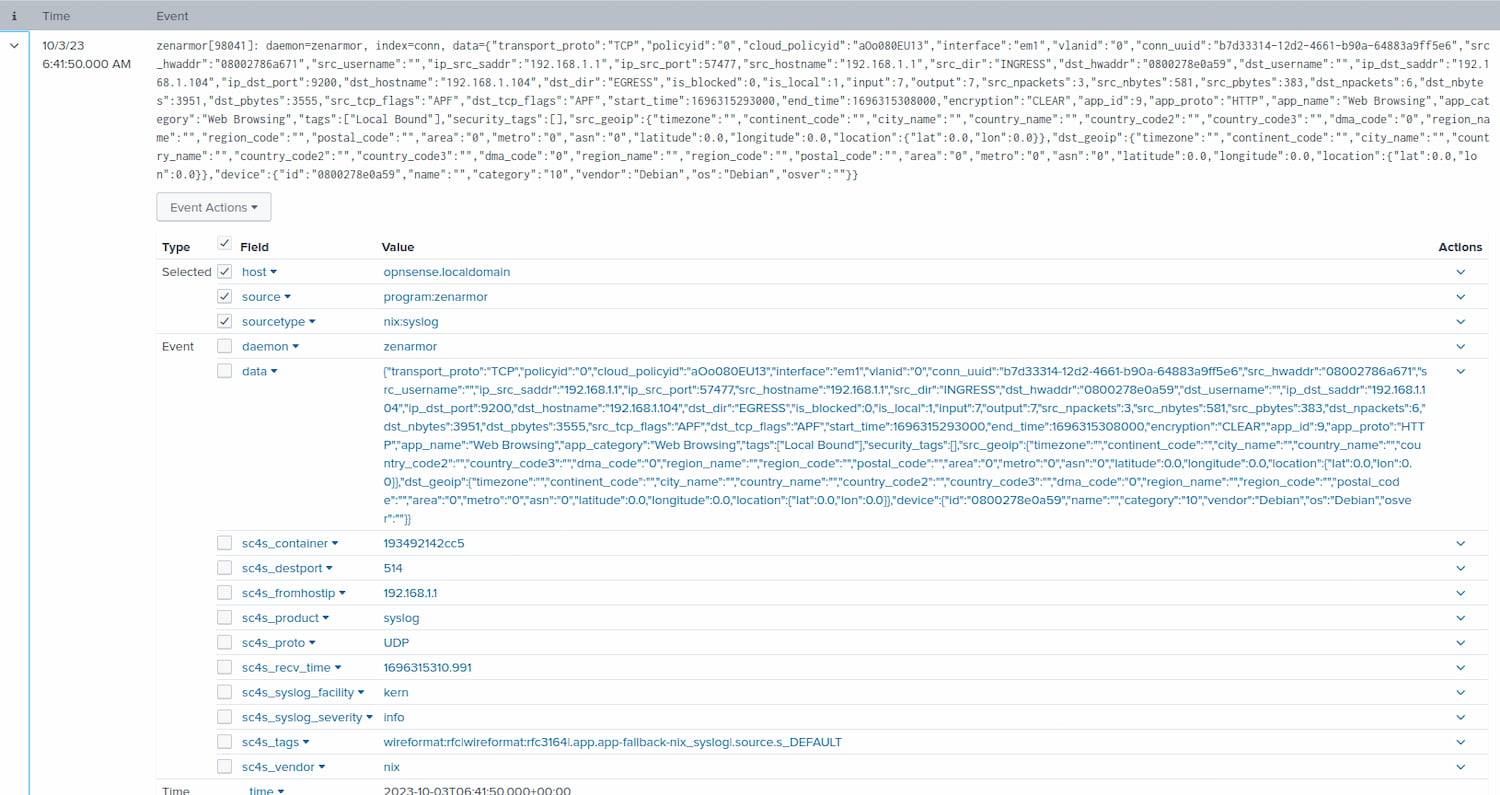
Figure 9: Expanded view of the Zenarmor log (Notice all the JSON-formatted data assigned to its own data field, which is not ideal.)
Fortunately, SC4S allows us to create a custom parser that will help solve the first issue where we can correctly specify the source type and index before the data is sent to the Splunk indexer, which we will cover in the next step.
Setting up a custom SC4S parser to enrich the Zenarmor Syslog metadata
Just a brief explanation as to what the SC4S parser does: It basically allows us to offload certain operations that would usually be done by the Splunk indexers at index time, like line-breaking, source/sourcetype settings, timestamps, etc. Both parsing and source onboarding are well documented if you would like to get into the details. For this guide, I am going to show you how I set up my custom Zenarmor parser. Keep in mind that this is just one approach to solving this problem. There are likely other ways you could achieve similar results using the Splunk indexers.
Firstly, I created a new directory for the Zenarmor parser at /opt/sc4s/local/config/app_parsers/zenarmor and then created a parser .conf file called app-syslog-zenarmor_zenarmor-ngfw.conf following the naming convention specified in the documentation.
In the .conf file, I have included the following code. Notice the comments following the #’s, which explain each section of the code, but in a nutshell, we are setting up the index, source/sourcetype, etc., and the filter checks for the custom listening setting that we setup in the env_file earlier.
# the block parser is where the "parsing" of the event happens and enrichment of metadata
block parser zenarmor-parser() {
channel {
        rewrite {
            #set defaults these values can be overridden at run time by splunk_metadata.csv
            r_set_splunk_dest_default(
                index("zen_conns")
                source("svn:zenarmor:ngfw")
                sourcetype('svn:zenarmor:ngfw')
                #this value is used to lookup runtime settings such as index from
                splunk_metadata.csv
                vendor("zenarmor")
                product("zenarmor-ngfw")
                #Common values are t_hdr_msg (BSD Style syslog without timestamp and host) and
                t_5424_hdr_sdat>
                #These values will be automatically selected based on the format of the source the
                specific va>
                template("t_hdr_msg")

            );
        };

    };
};
application zenarmor_ngfw[sc4s-network-source] {
        filter {

        program('zenarmorngfw' type(string) flags(prefix))
        #this checks the custom port setup in the env_file that was setup previously
        #e.g. SC42_LISTEN_ZENARMOR_UDP_PORT=514

        or tags(".source.s_ZENARMOR");

    };
    parser { zenarmor-parser(); };
};
Once done, you will need to restart SC4S by simply shutting down docker-compose and restarting. If all goes well, SC4S should restart without errors. If you return to your Splunk search head and search index=”zen_conns” you should now see Zenarmor syslog events being correctly stored in the zen_conns index, and you will also notice the correct source and sourcetype being specified as svn:zenarmor:ngfw like we set up in the parser.
As for the JSON-formatted Zenamor data, you will notice that the data field has not been created at all. In the next step, we are going to look at how we can extract the JSON data into its own fields using Splunk transforms.conf and props.conf.
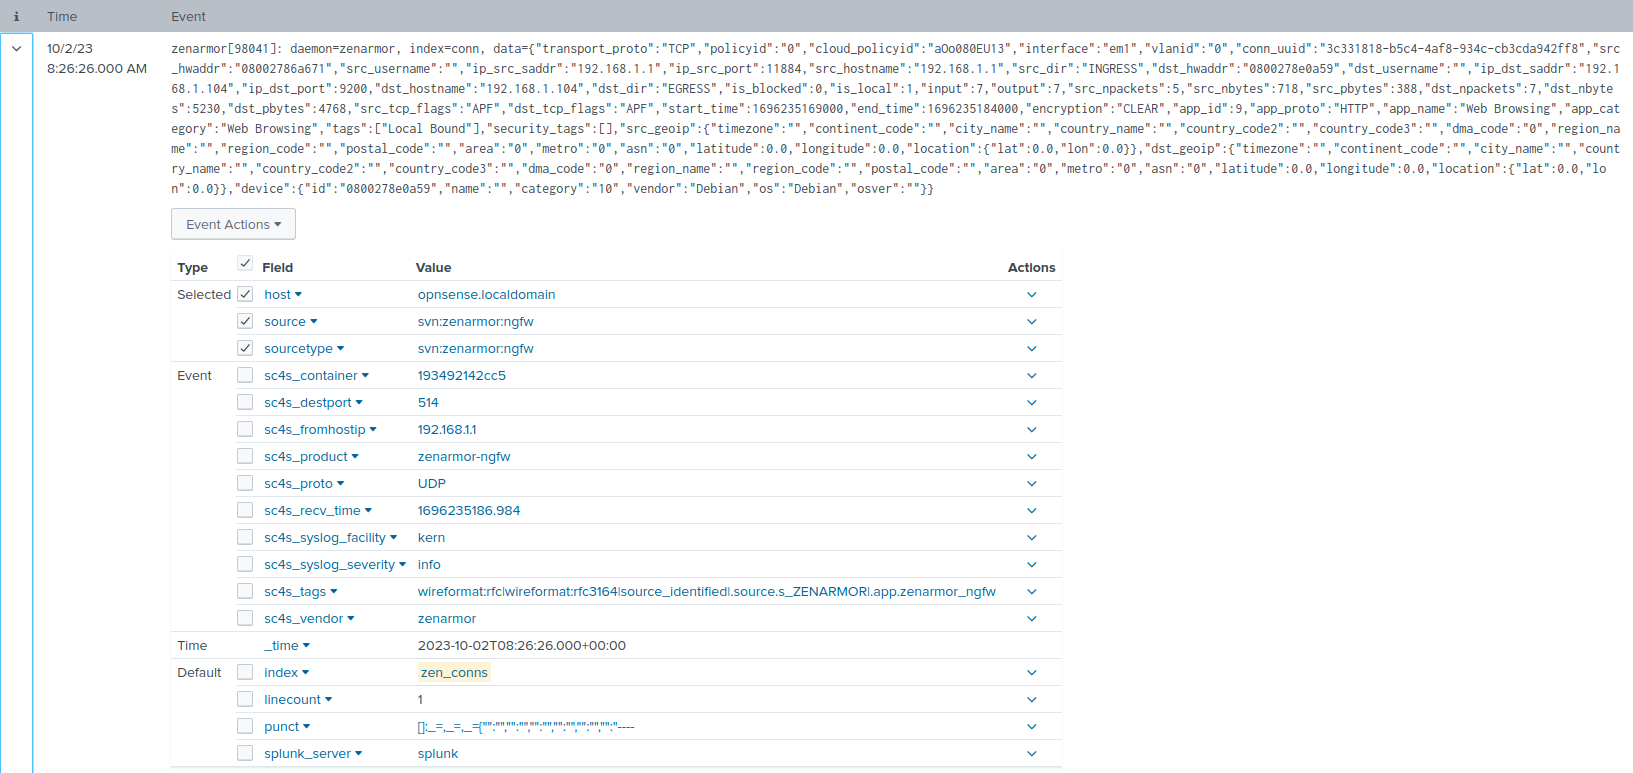
Figure 10: Parsed Zenarmor syslog event with the correct sourcetype and index
Extracting Zenarmor data fields using transforms.conf and props.conf
The final step to successfully ingesting Zenarmor syslog events into Splunk Enterprise is to extract the connection data created by Zenarmor, which is stored in a JSON format. This is the most important step in the process because without extracting the data, we can’t easily search for or use it for anything useful, like creating dashboards or visualizations.
In order to extract the data into its respective fields, I have chosen to do this using Splunk’s transforms.conf and props.conf. As I said before, this is just one way of doing this; you could also extract at search time using other methods, like using the spath command.
Both the .conf files can be found under the Zenarmor App directory /opt/splunk/etc/apps/zenarmor/local that was set up at the beginning of this demonstration. If transforms.conf is not there, you can create the file and include the following:
[zen_json_extract]
SOURCE_KEY = _raw
DEST_KEY = _raw
REGEX = data=(.+})
FORMAT = $1
A breakdown of the above configuration is as follows:
- The zen_json_extract in the square brackets is the unique stanza name that we will later reference in the props.conf
- The SOURCE_KEY and DEST_KEY are set to their defaults, _raw.
- REGEX is the regular expression used to search the syslog event; in this case, we are interested in everything after data={
- FORMAT is used in conjunction with REGEX and acts as a “placeholder” variable for everything returned from the regular expression match, in this case, all the JSON data.
To build and check that the regular expression works, I used the regex101.com tool to make this easier.
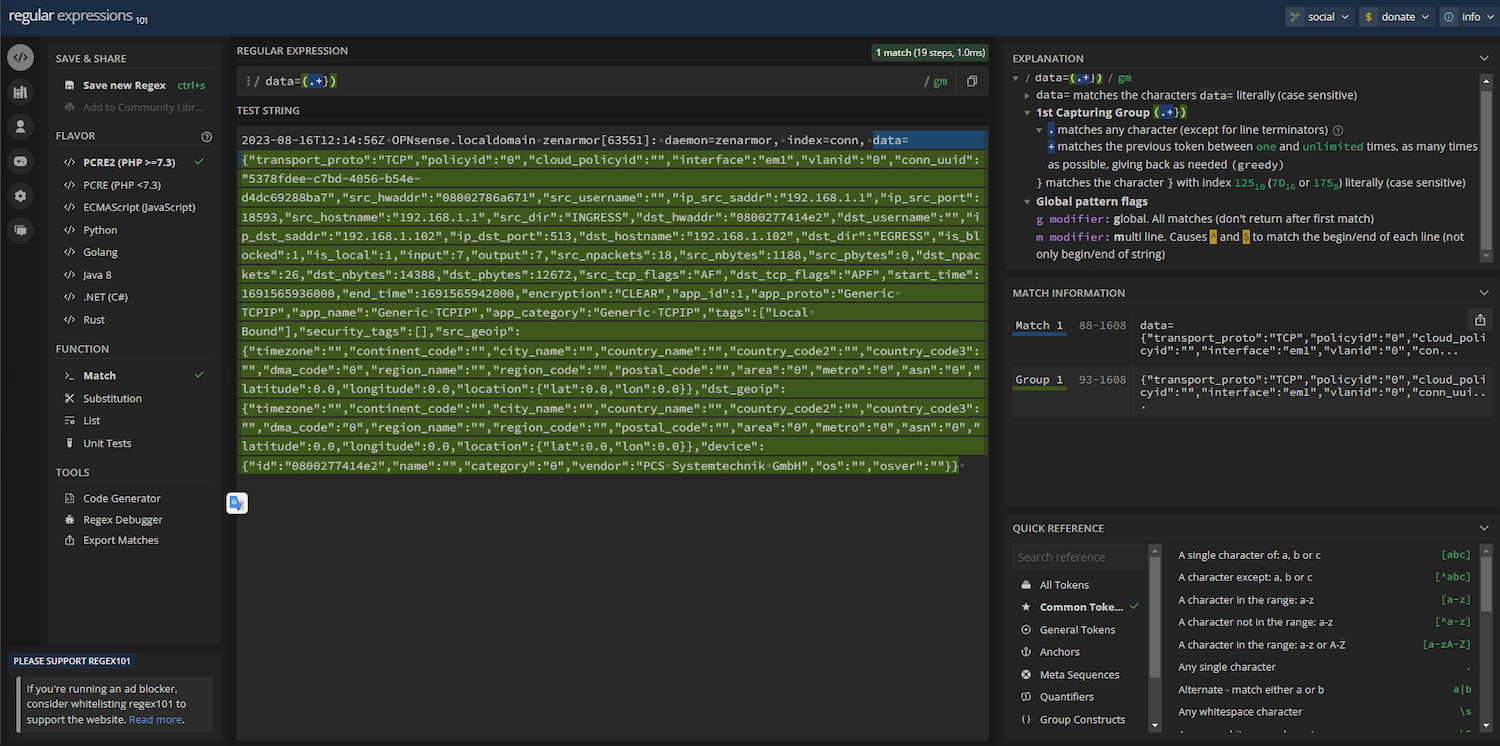
Figure 11: Regex101 tool showing the desired JSON data being extracted from the syslog event.
Now that transforms.conf is set, we need to finish by adding the following to props.conf:
[svn:zenarmor:ngfw]
KV_MODE = json
TRANSFORMS-zenjsonextraction = zen_json_extract
A breakdown of the above configuration is as follows:
- The [svn:zenarmor:ngfw] stanza, in this case, refers to the sourcetype that we set up when creating the SC4S parser.
- The KV_MODE = json automatically extracts the JSON data at search time that we matched in the transforms.conf in the previous step.
- TRANSFORMS-zenjsonextraction = zen_json_extract references the stanza in the transforms.conf we created in the previous step.
Once you have completed this setup, you will need to restart your Splunk Enterprise instance for the changes to apply correctly. If you are on Linux, you can type sudo /opt/splunk/bin/./splunk restart
Observing the transformed Zenarmor Syslog data and field extractions
Once Splunk Enterprise has restarted, head to your Zenarmor App in the Splunk Enterprise dashboard and search the zen_conns index. You should now see the Zenarmor syslog JSON event data correctly extracted into unique fields. It is ready for searching and creating visual dashboards.
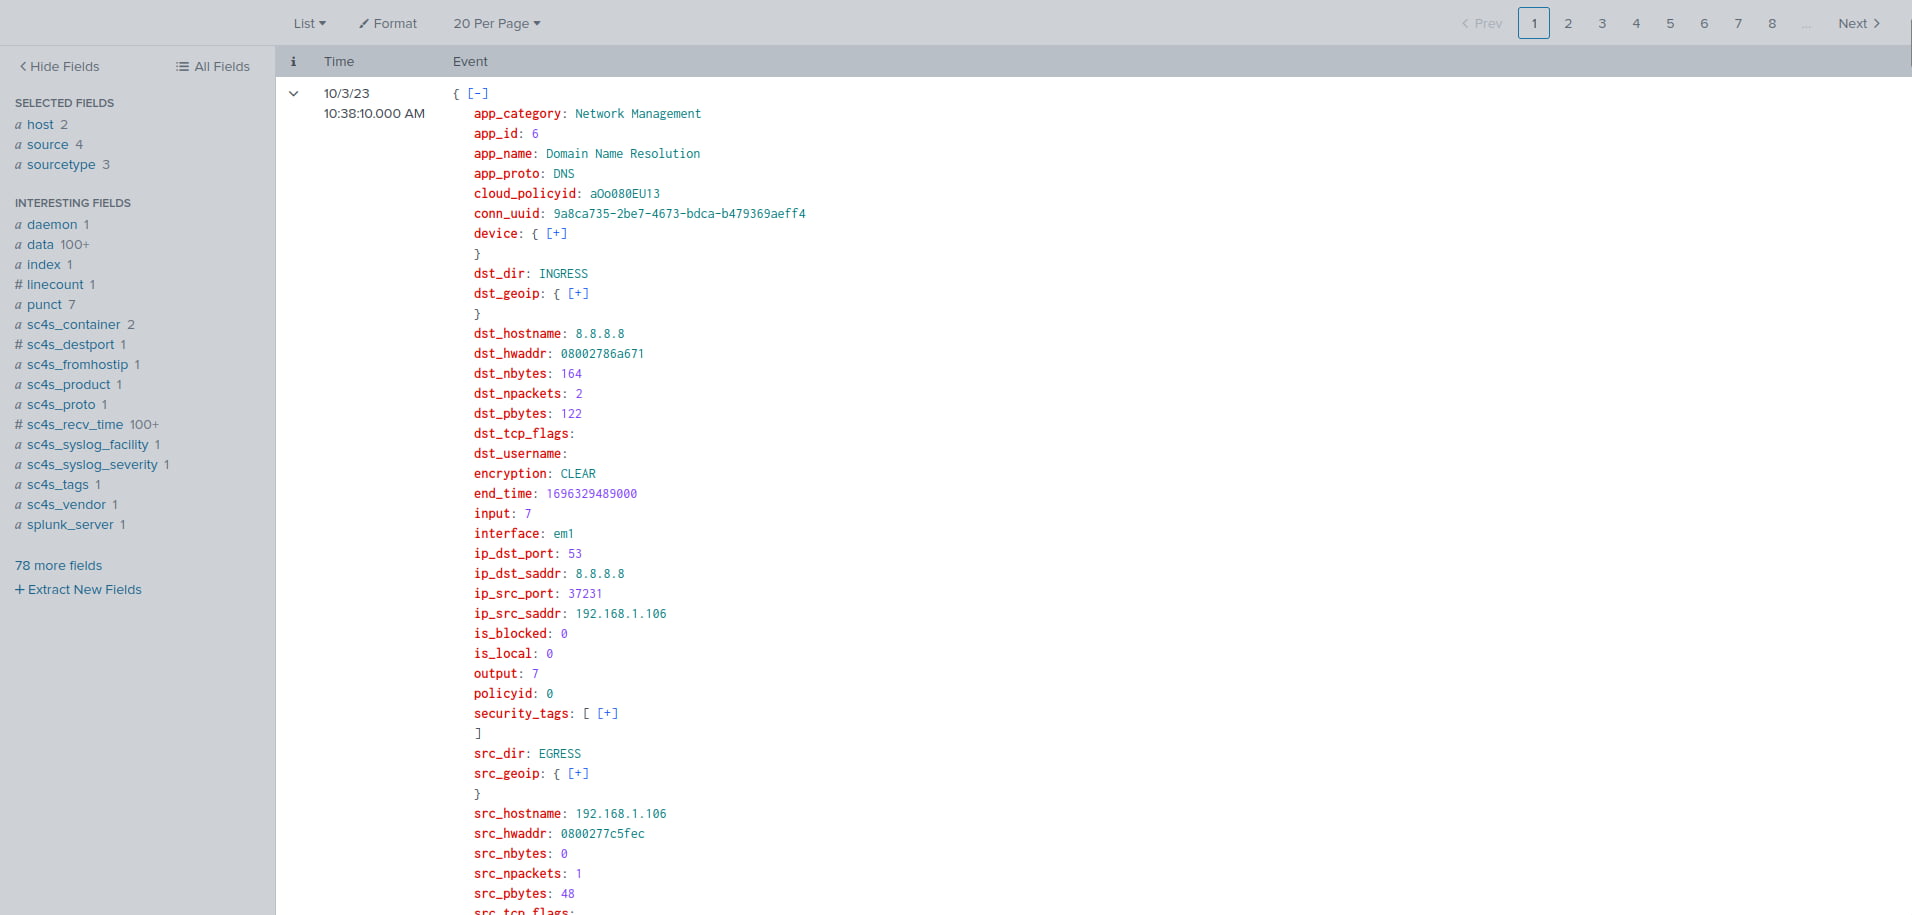
Figure 12: Zenarmor syslog JSON event data correctly displayed
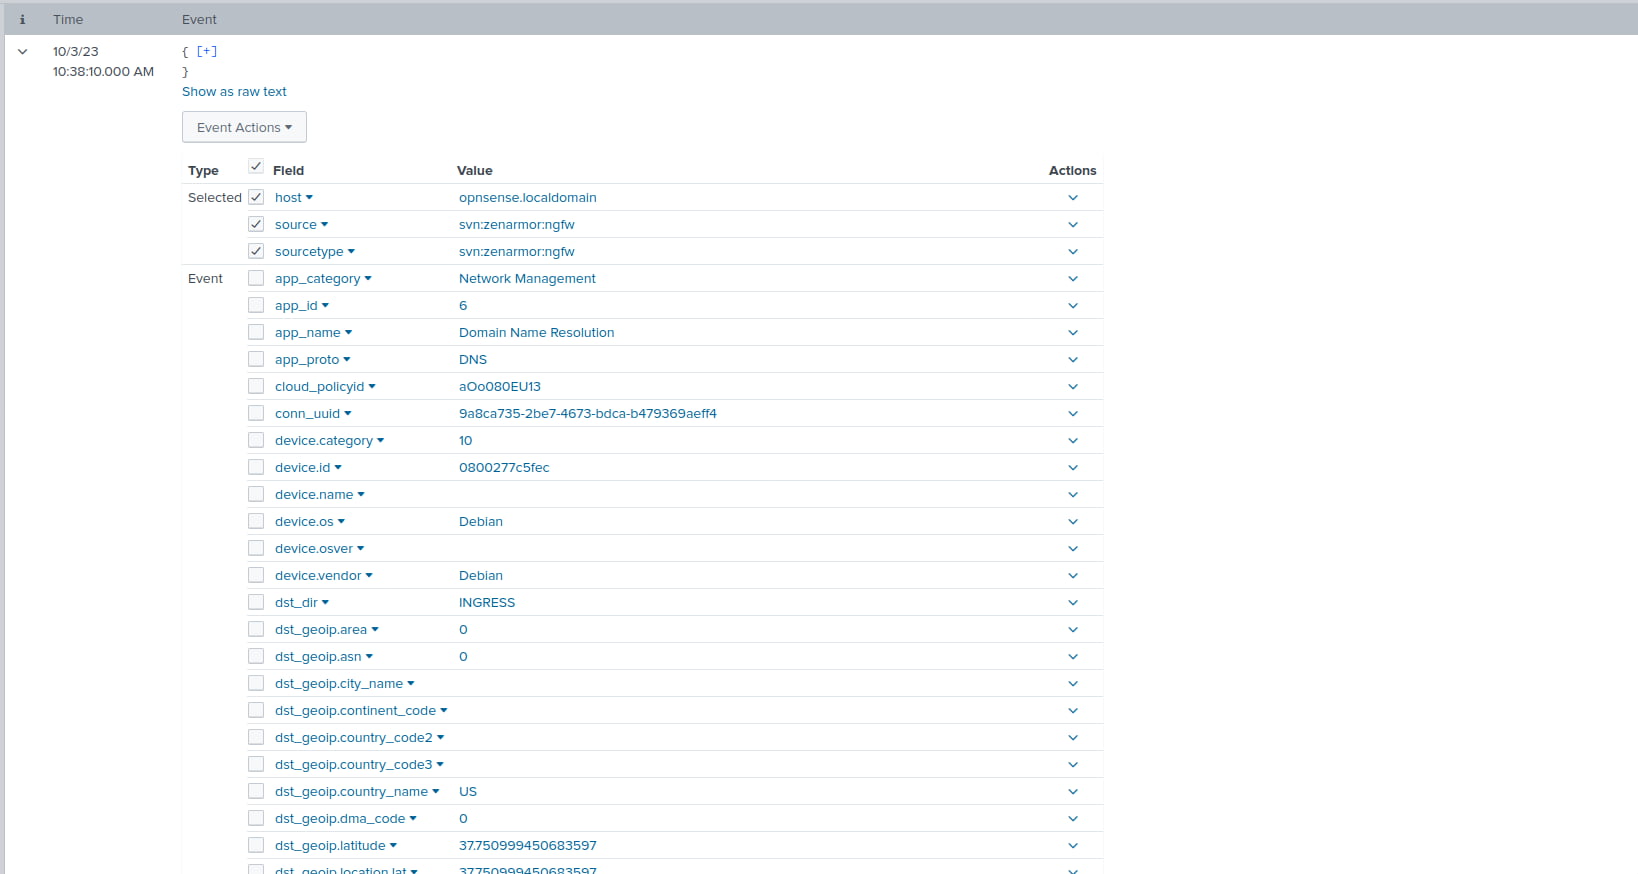
Figure 13: Correctly extracted fields which can now be used for granular searching and creating vizualizations
Wrapping things up…
Zenarmor creates a wealth of accurate and actionable log data while filtering and securing your network traffic, which is highly useful to SOC analysts and enables them to better detect, investigate, and respond to threats in your environment.
If you are an MSSP or a business that uses Splunk Enterprise and Zenarmor, I highly encourage you to try this integration. Can you really afford not to be collecting this log data from Zenarmor?
If you are new to Zenarmor and are exploring all its enterprise capabilities, you can get started by signing up for a 15-day free trial.