To continue with the series of Zenarmor SIEM integration guides that I have created over the last few months, today we are going to look at how we can integrate Zenarmor with Datadog. Datadog is slightly different from the previous SIEMs we have covered because it’s the only one that is a SaaS-only solution, meaning we can’t self-host this solution as we covered in the Wazuh, ELK, and Splunk Enterprise guides.
Regardless of the differences, Datadog is a popular and powerful monitoring and security platform, and it only makes sense to include it in this Zenarmor SIEM integration series.
So without further ado, let’s get to the fun part and dive into the configuration.
Initial setup of Datadog
For this guide, I assume that you already have an account with Datadog; if not, it’s straightforward to set one up, head over to their site, and sign up for a 14-day trial so that you can follow along.
Because Datadog is a SaaS solution, there is no long-winded process of setting up your own servers and infrastructure. We are simply going to be streaming our Syslog data to Datadog via the Internet, and all the configurations you will see in this guide are done using their intuitive dashboard.
Before we stream any log data to Datadog, I like to set up a unique index for each set of log data to create a separation between what is collected. This will help when querying data at a later date.
To set up the index for Zenarmor specific logs, you will need to navigate to Logs->Configuration, and at the top of the configuration menu, you will need to select “Indexes”
You will notice that if this is a fresh instance of Datadog, there will at least be a “main” index already defined as default. To create a new index, click “New Index” and provide a Name; in my case, I called it “zen-conns”. You will also need to define a filter.
As for the filter, set this to Source:zenarmor for now. In the coming steps, we will define the source when we set up Rsyslog.
Regarding the index retention, you can leave these periods as default.
In the index list, make sure that you drag the new “zen-conns” index above the main index using the controls to the right, so that it takes preference when filtering for Source:zenarmor.
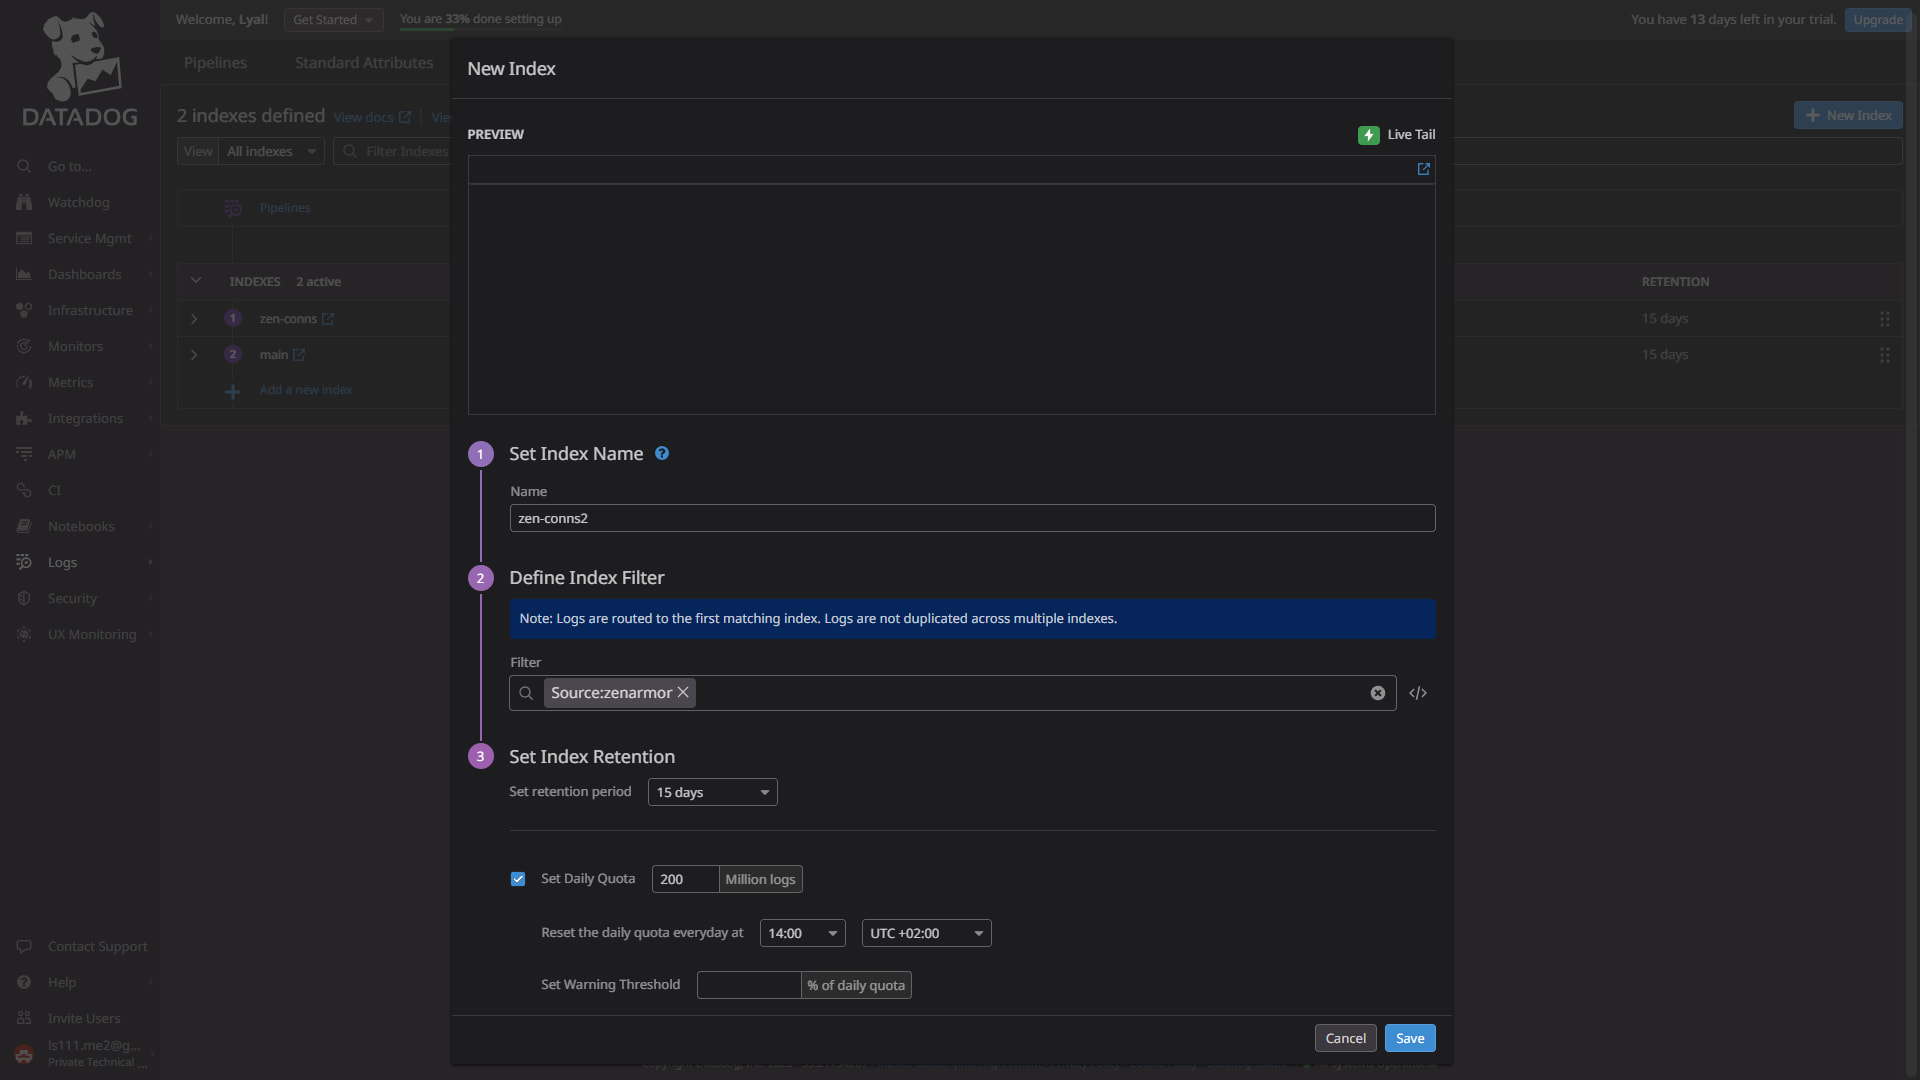
Figure 1: Creating a new zen-conns index
Before we move on to the next step, you are going to want to have your Datadog API key nearby. To find it, go to the organization settings menu, as seen in the image below. Select API keys and a list of keys will be displayed.
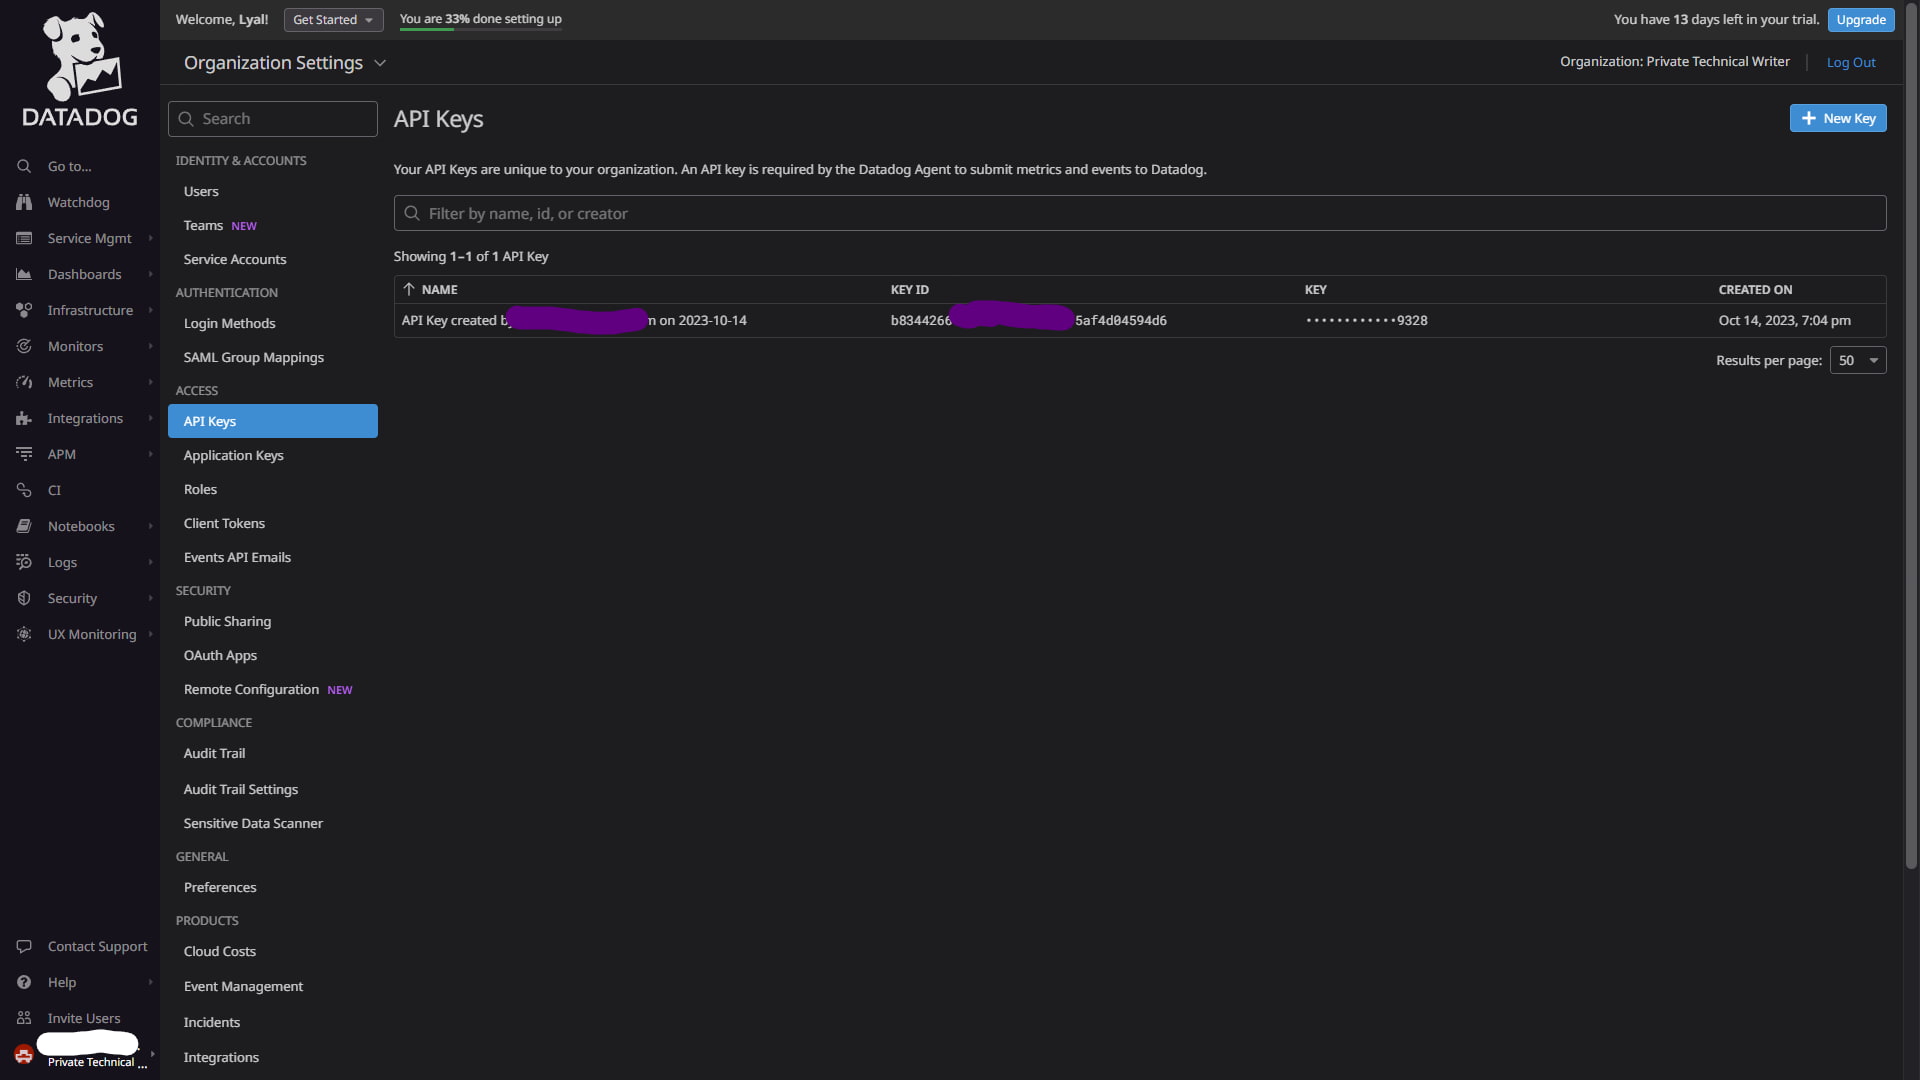
Figure 2: Organization settings menu where you can access your Datadog API key
Setting up Rsyslog to collect the log data from Zenarmor
For this guide, I chose to use Rsyslog as my syslog collector because it’s well-documented and came preinstalled on the Ubuntu 22.04 server I have running in the lab. Datadog also conveniently supports it. If you would like to explore an alternative, you can also use Syslog-ng, which is also supported by Datadog and should give you similar results.
The first step in setting up Rsyslog is to activate the built-in module to allow it to listen on UDP port 514, where we will be streaming our syslog log data from Zenarmor. To do this, we need to modify the /etc/rsyslog.conf by adding the below configuration. I have included comments explaining each line:
module(load="imfile" PollingInterval="10")  #enable this for datadog

# provides UDP syslog reception
module(load="imudp")
input(type="imudp" port="514")

#filter for connections coming from Zenarmor (192.168.1.1) only and stores log data in /var/log/zen_conns.log

If $fromhost-ip == "192.168.1.1" then {
Action (type="omfile" file="/var/log/zen_conn.log")
}

# provides TCP syslog reception if you prefer TCP just uncomment the #
#module(load="imtcp")
#input(type="imtcp" port="514")
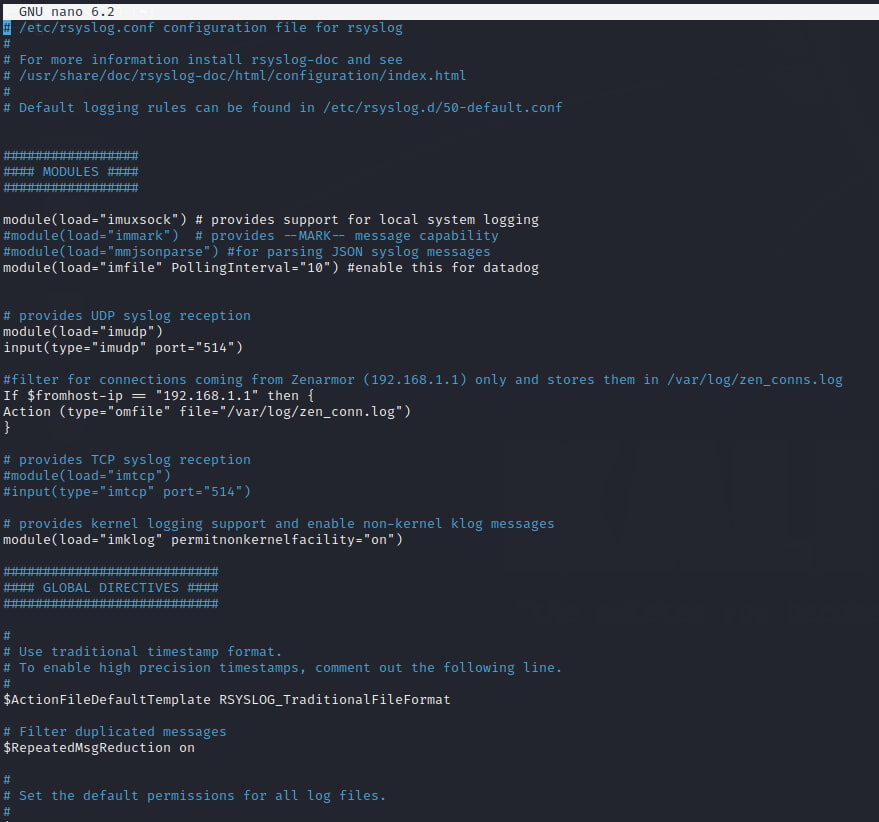
Figure 3: Completed rsyslog.conf, yours should look similar
The second part of this process is to create a Datadog-specific “.conf” file that allows Rsyslog to establish communication with the Datadog service without using an agent.
Before we do this, we need to install the TLS package to encrypt the log data traversing the internet. While this is not necessarily compulsory, it’s advised to prevent any third party from listening in on our log data. Simply use the below command to install the packages:
sudo apt-get install rsyslog-gnutls ca-certificates
Once done, create the .conf file in /etc/rsyslog.d/ */ I called mine datadog.conf and populated it with the below configuration, being sure to include your API key in the space provided:
## Specify the log file to sent to Datadog, in this case, the one created in the previous step

input(type="imfile" ruleset="infiles" Tag="ZenarmorNGFW" File="/var/log/zen_conn.log" StateFile="Zen1")

#Points to where the certificates are located as part of the TLS configuration so that we can use TLS to encrypt log data being sent via the internet

$DefaultNetstreamDriverCAFile /etc/ssl/certs/ca-certificates.crt


## Set the Datadog format used when sending logs, supply your API key, include ddsource=\”zenarmor”\ to create a source tag.

$template DatadogFormat,"<YourAPIkey> <%pri%>%protocol-version% %timestamp:::date-rfc3339% %HOSTNAME% %app-name% - - [metas ddsource=\"Zenarmor\"] %msg%\n"

## Default ruleset used to establish a connection to Datadog on port 10516, as well as activates the TLS encryption

ruleset(name="infiles") {
action(type="omfwd" protocol="tcp" target="intake.logs.datadoghq.com" port="10516" template="DatadogFormat" StreamDriver="gtls" StreamDriverMode="1" StreamDriverAuthMode="x509/name" StreamDriverPermittedPeers="*.logs.datadoghq.com" )
Restart your Rsyslog service using the following command to apply the configuration:
sudo systemctl restart rsyslog

Figure 4: Completed datadog.conf as per the above steps
Just a note: I chose to use the US-based Datadog intake endpoints to stream my logs to; however, they have intake endpoints in the EU and other parts of the world, so you may need to change the “target=” portion of the config to reflect this. If you need more information about this, please check out the official Datadog documentation.
Setting up Zenarmor to stream syslog data to Rsyslog
In order for Zenarmor to stream its Syslog event data to Rsyslog, we need to enable streaming reporting data on the Zenarmor dashboard under Settings->Data Management.
You will need to point Zenarmor to your Rsyslog instance; in my case, Rsyslog is at 192.168.1.108, listening on UDP port 514. You can also use TCP if you prefer. I have chosen to send all connection data to Rsyslog. However, you can also select Web, DNS, TLS and Alert specific data if you wish. Once configured, click the “Update” button, and Zenarmor will start streaming log data to Rsyslog.

Figure 5: Zenarmor syslog configuration
Testing that Rsyslog is streaming Syslog data to the Datadog intake endpoint
If all goes well, Syslog data should begin streaming from Zenarmor to Rsyslog and finally to Datadog. To test this on your Rsyslog server, simply inspect the syslog logs at /var/log/syslog using the following tail command:
tail syslog
The output should be similar to the below image, where you can see syslog data being populated. You can also use this log for further troubleshooting if you run into issues.
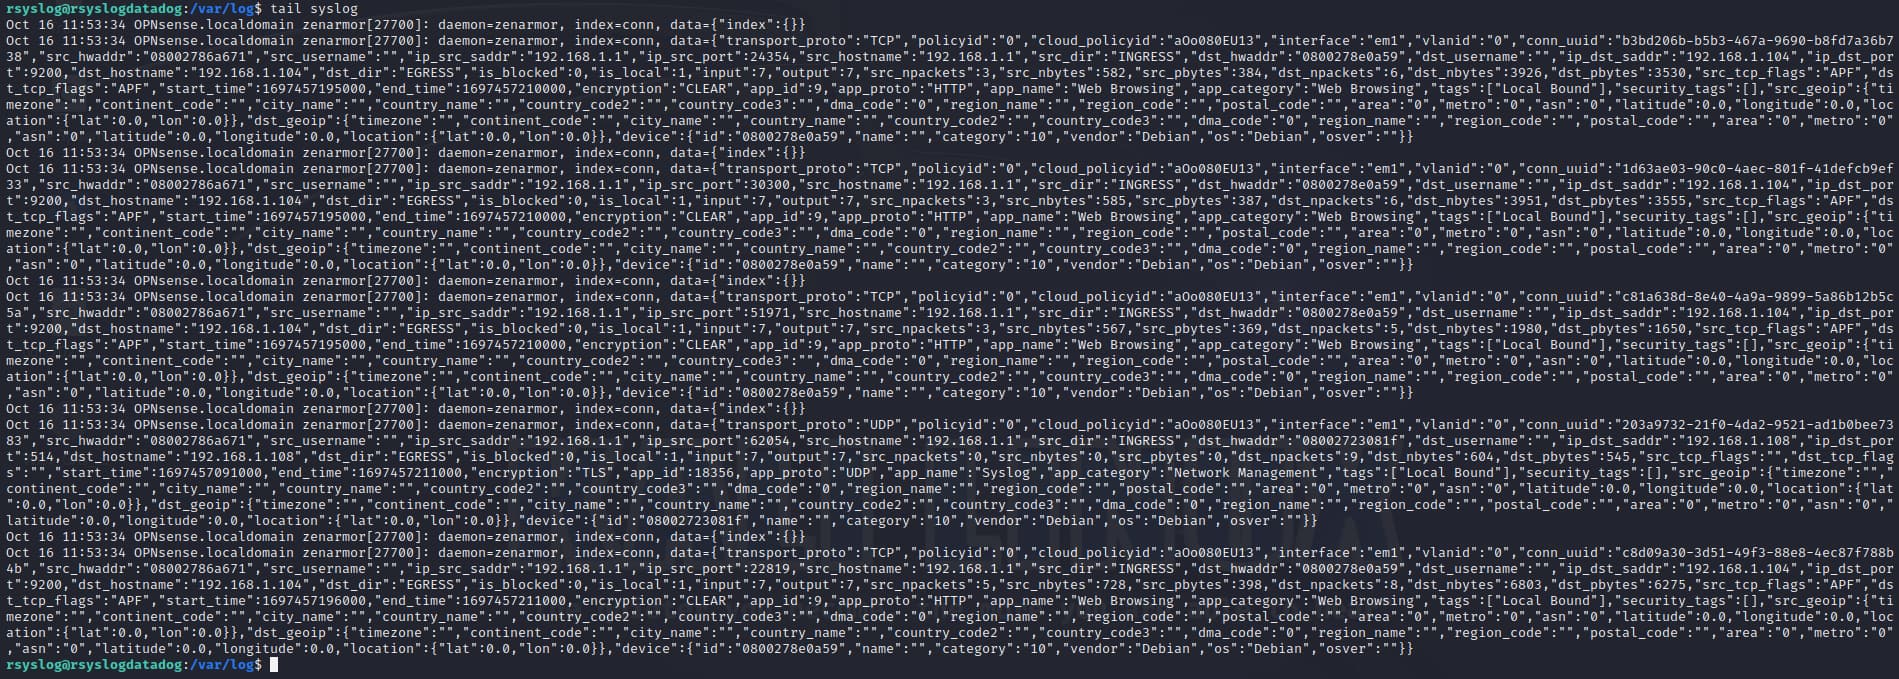
Figure 6: Example of the tail output of the syslog log file
Now head over to the Datadog dashboard, navigate to “Logs” and click “Search” and the dashboard will be displayed, showing the Zenarmor syslog data streamed from Rsyslog, similar to the image below.
You will, however, note that when you select one of your logs from the list, none of the important data stored in the JSON string has been extracted from the syslog message. This is because Datadog does not understand what to do with it yet, which is not ideal because we need to be able to search the attributes and data if we want to do anything meaningful with it.
To fix this, we need to build a custom Datadog pipeline that filters this data through a parsing processor to extract the data stored in the log, which we will cover in the next step.
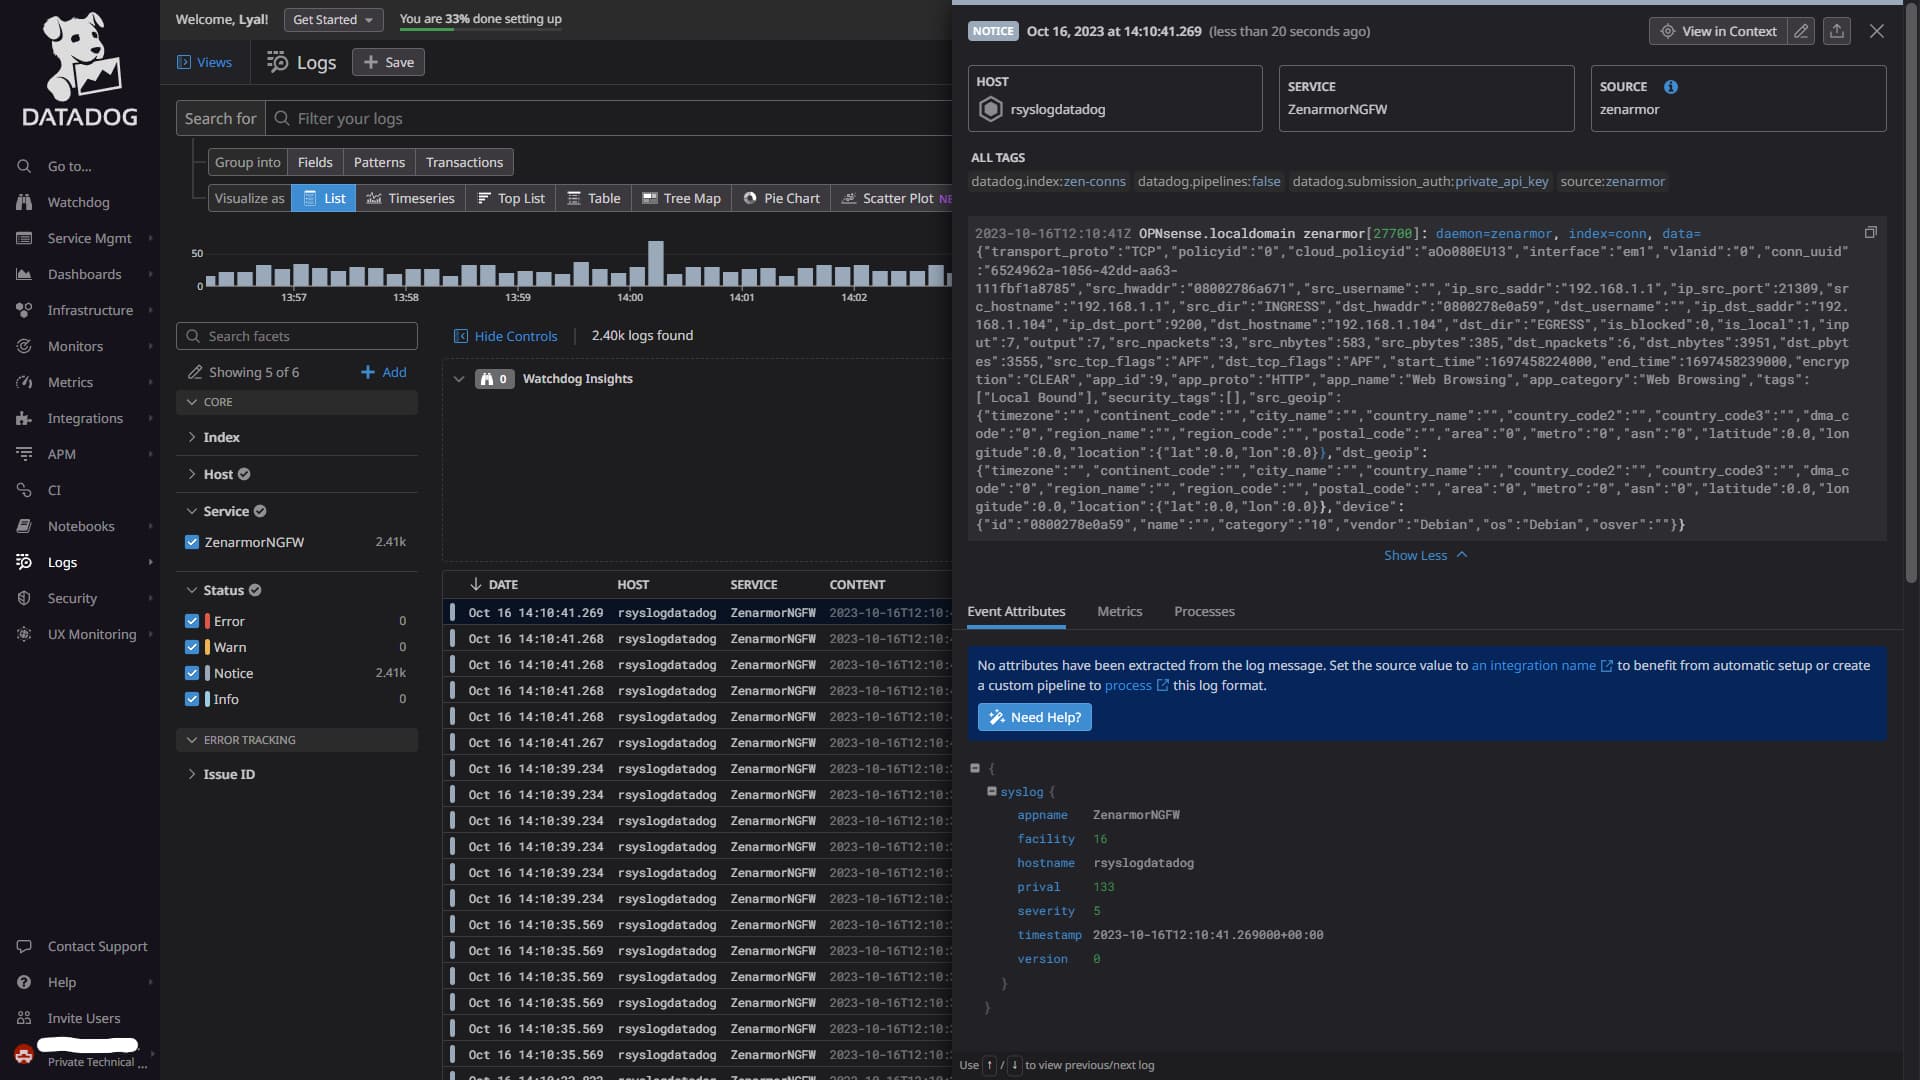
Figure 7: Example of an unparsed Zenarmor log in Datadog showing only partial attributes extracted
Building a pipeline in Datadog to parse the Zenarmor syslog data
To start building the pipeline, you need to once again go to “Logs” -> “Configuration” and at the top of the dashboard, you will see “Pipeline”. Select it and create a new pipeline.
In the filter box, use Source:zenarmor since we want this pipeline to only filter for Syslog data coming from Zenarmor. Give your pipeline a name, tag, and description, and click “Save”. Your final setup should look similar to the image below.
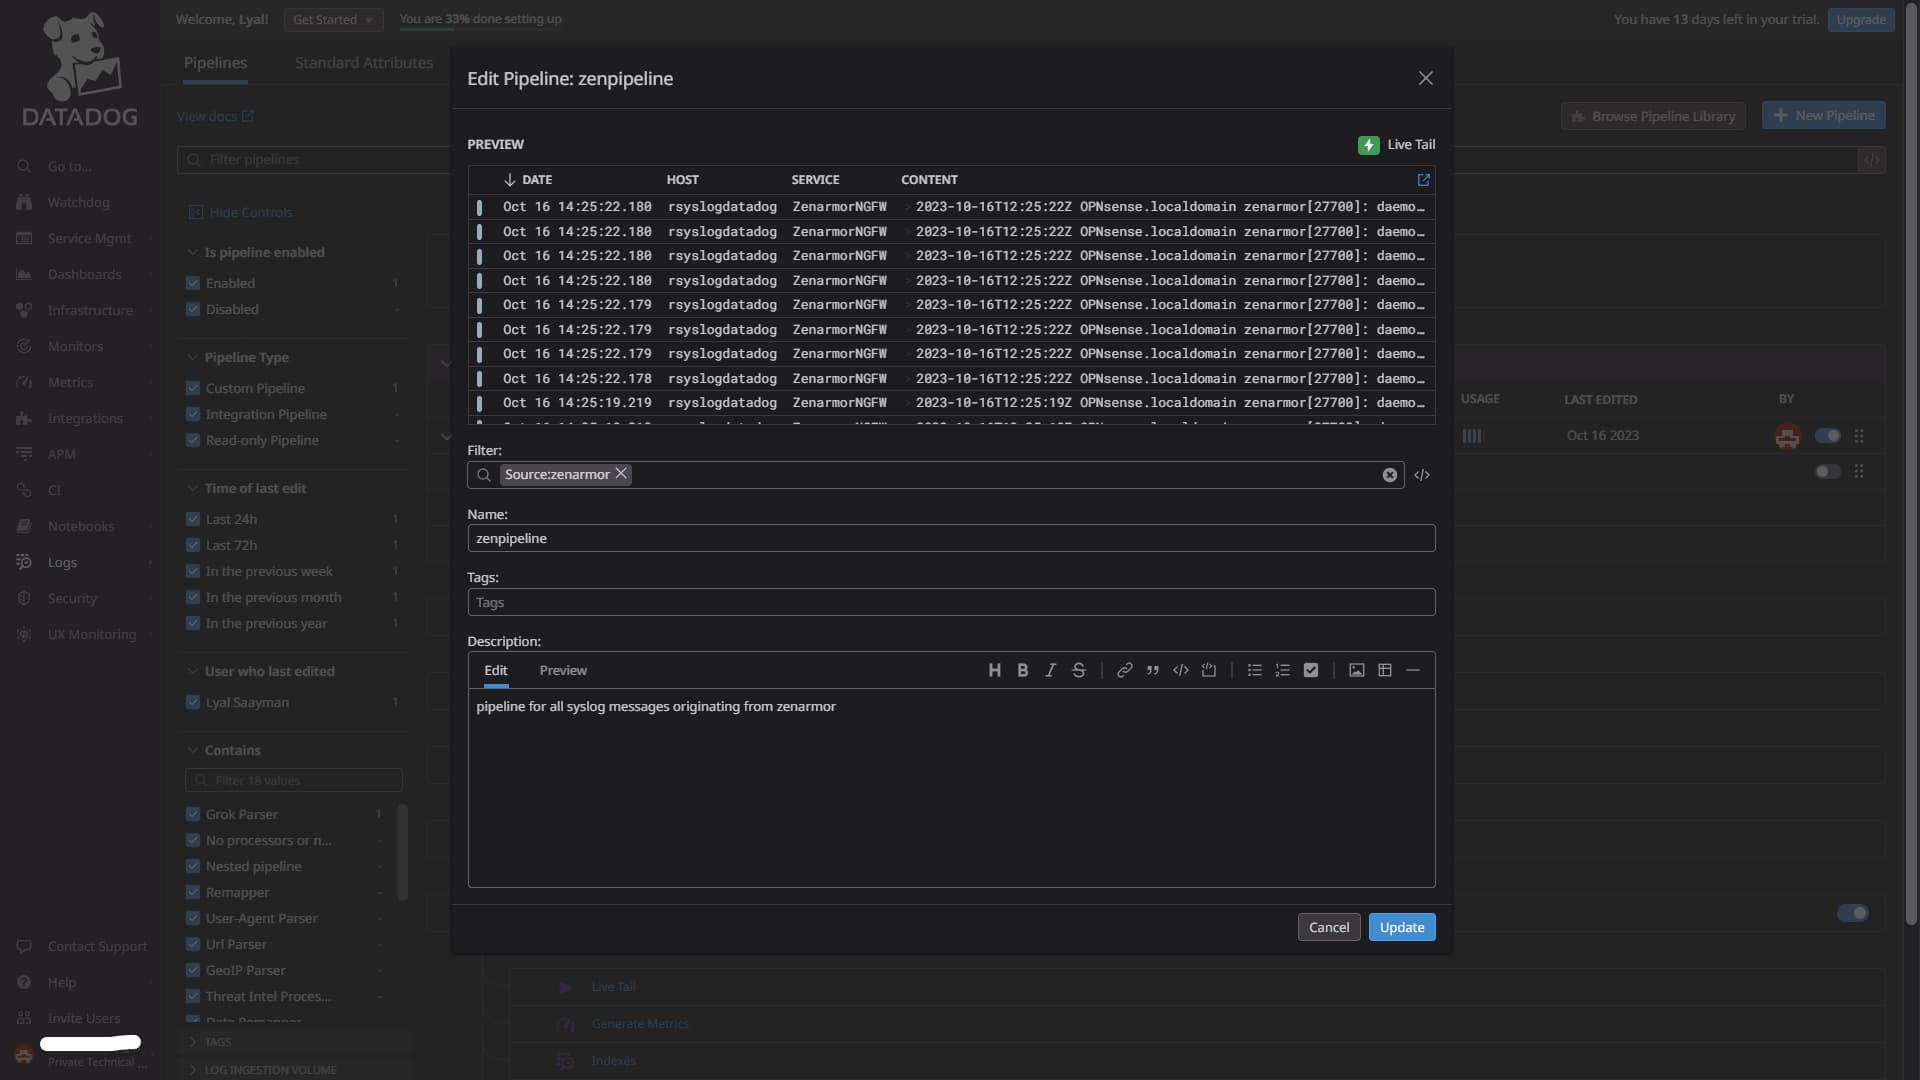
Figure 8: Example of a completed pipeline configuration menu
Now that our pipeline is set up and filtering for syslog data originating from Zenarmor, we need to add a processor to the pipeline to help extract the individual attributes that we are after.
To do this, use the Logs Configuration dashboard, and just below your pipeline, you will see the option to “Add Processor”. Click this and select “Grok Parser” from the dropdown. Give your processor a name and supply a log sample. You can copy this from one of the existing unparsed logs, or alternatively, click the “Parse My Logs” button, and Datadog will attempt to parse the log for you.
In this case, we are going to define our own Grok parsing rule using the below rule:
json_extract %{date("yyyy-MM-dd'T'HH:mm:ssZZ"):date} .* data=%{data:data:json}
The rule is called json_extract. First, we are matching for the %date using the above time/date pattern. I then used the .* wildcard to ignore everything after the date and before data=.. Because the data we are interested in is conveniently provided in JSON format, I have made use of the %data matcher and filtered using the built-in JSON filter, as seen in the command %{data:data:json}.
The result should be something similar to the image below, where all the JSON data has been extracted:
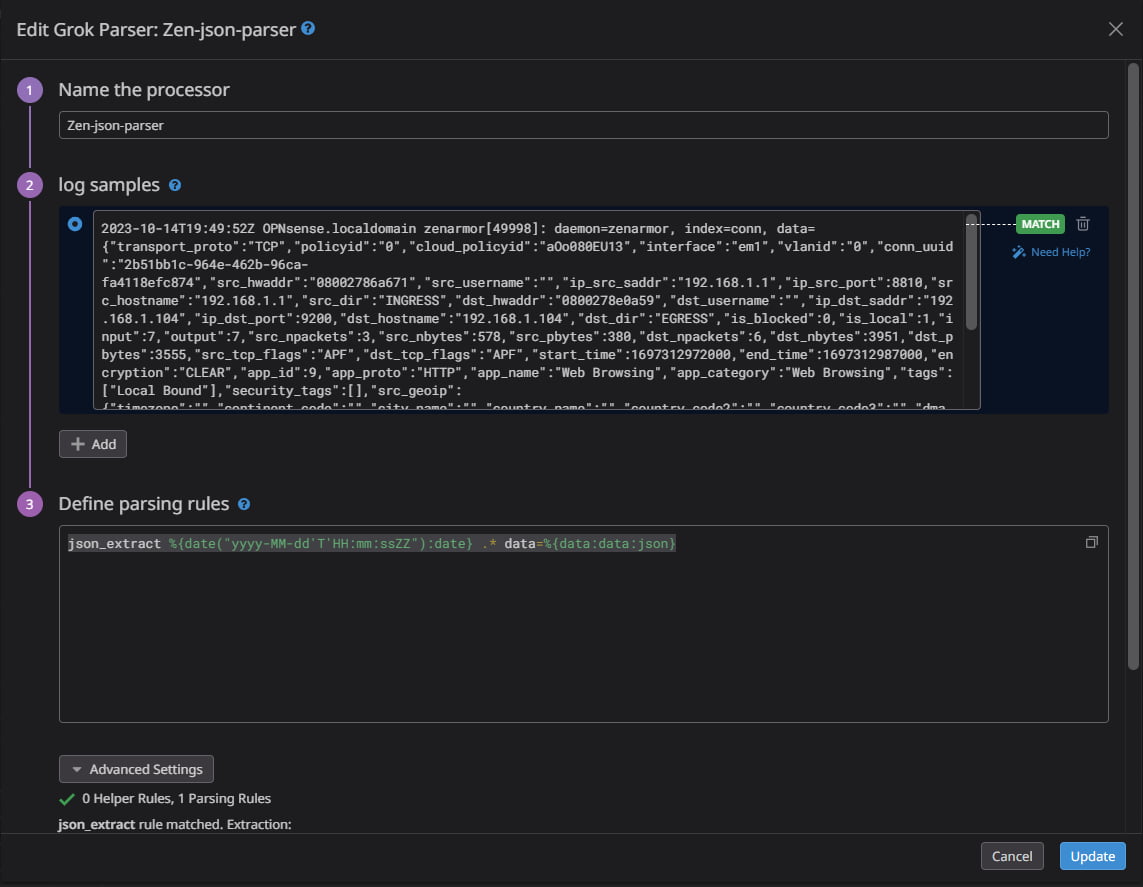
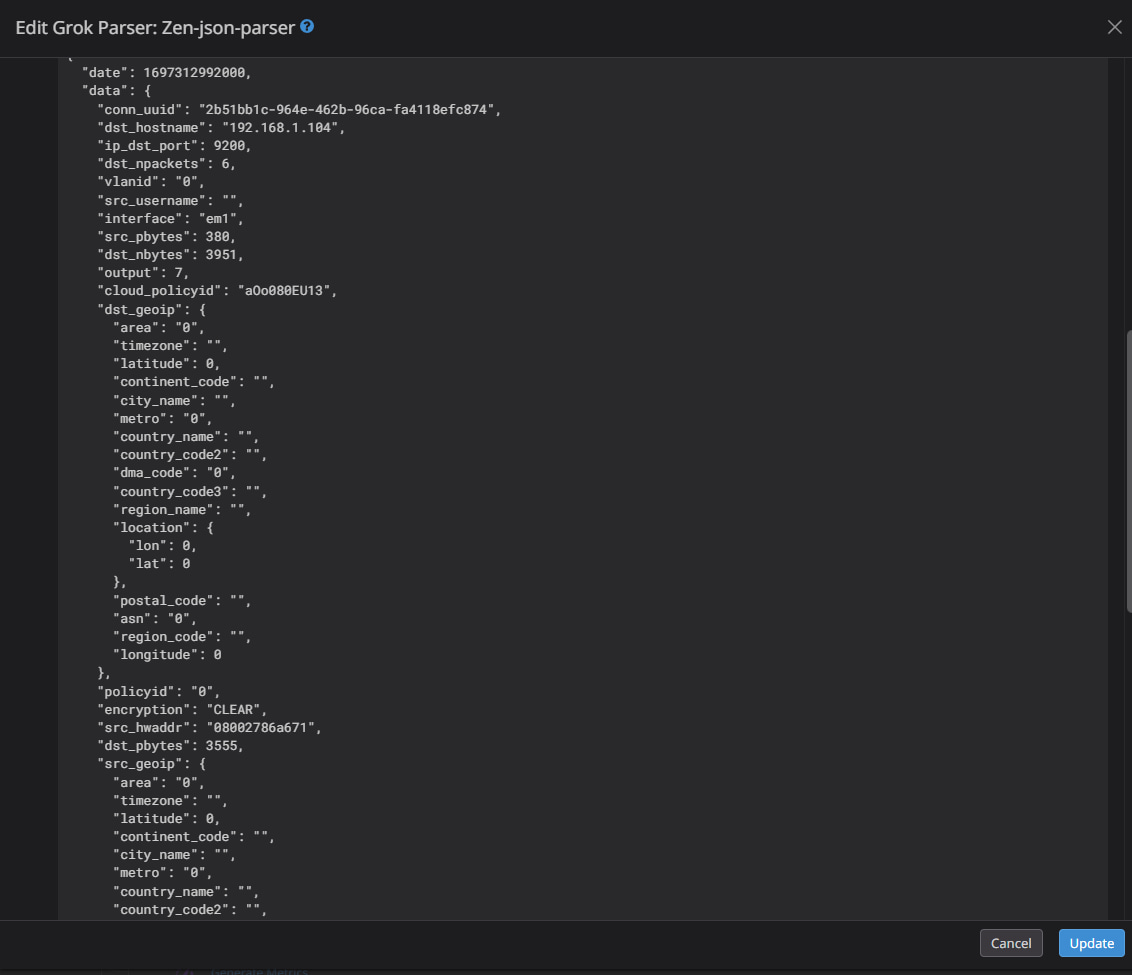
Figure 9: Example of a completed Grok processor matching the Zenarmor log sample and correctly parsing the JSON data so that those attributes can be used within Datadog
Click “Save” and your processor will apply.
If you would like more information about Datadog Pipelines and Processors feel free to check out the Datadog Log Parsing documentation.
Testing the pipeline and processor to ensure the proper extraction of data
To test that the pipeline is working and that the data is being processed and extracted correctly, head over to “Logs” -> “Live Tail”. Select one of the log events in the list, and to the right of the dashboard, you will immediately notice that all the “Event Attributes” have been successfully extracted, similar to what is seen in the below image.
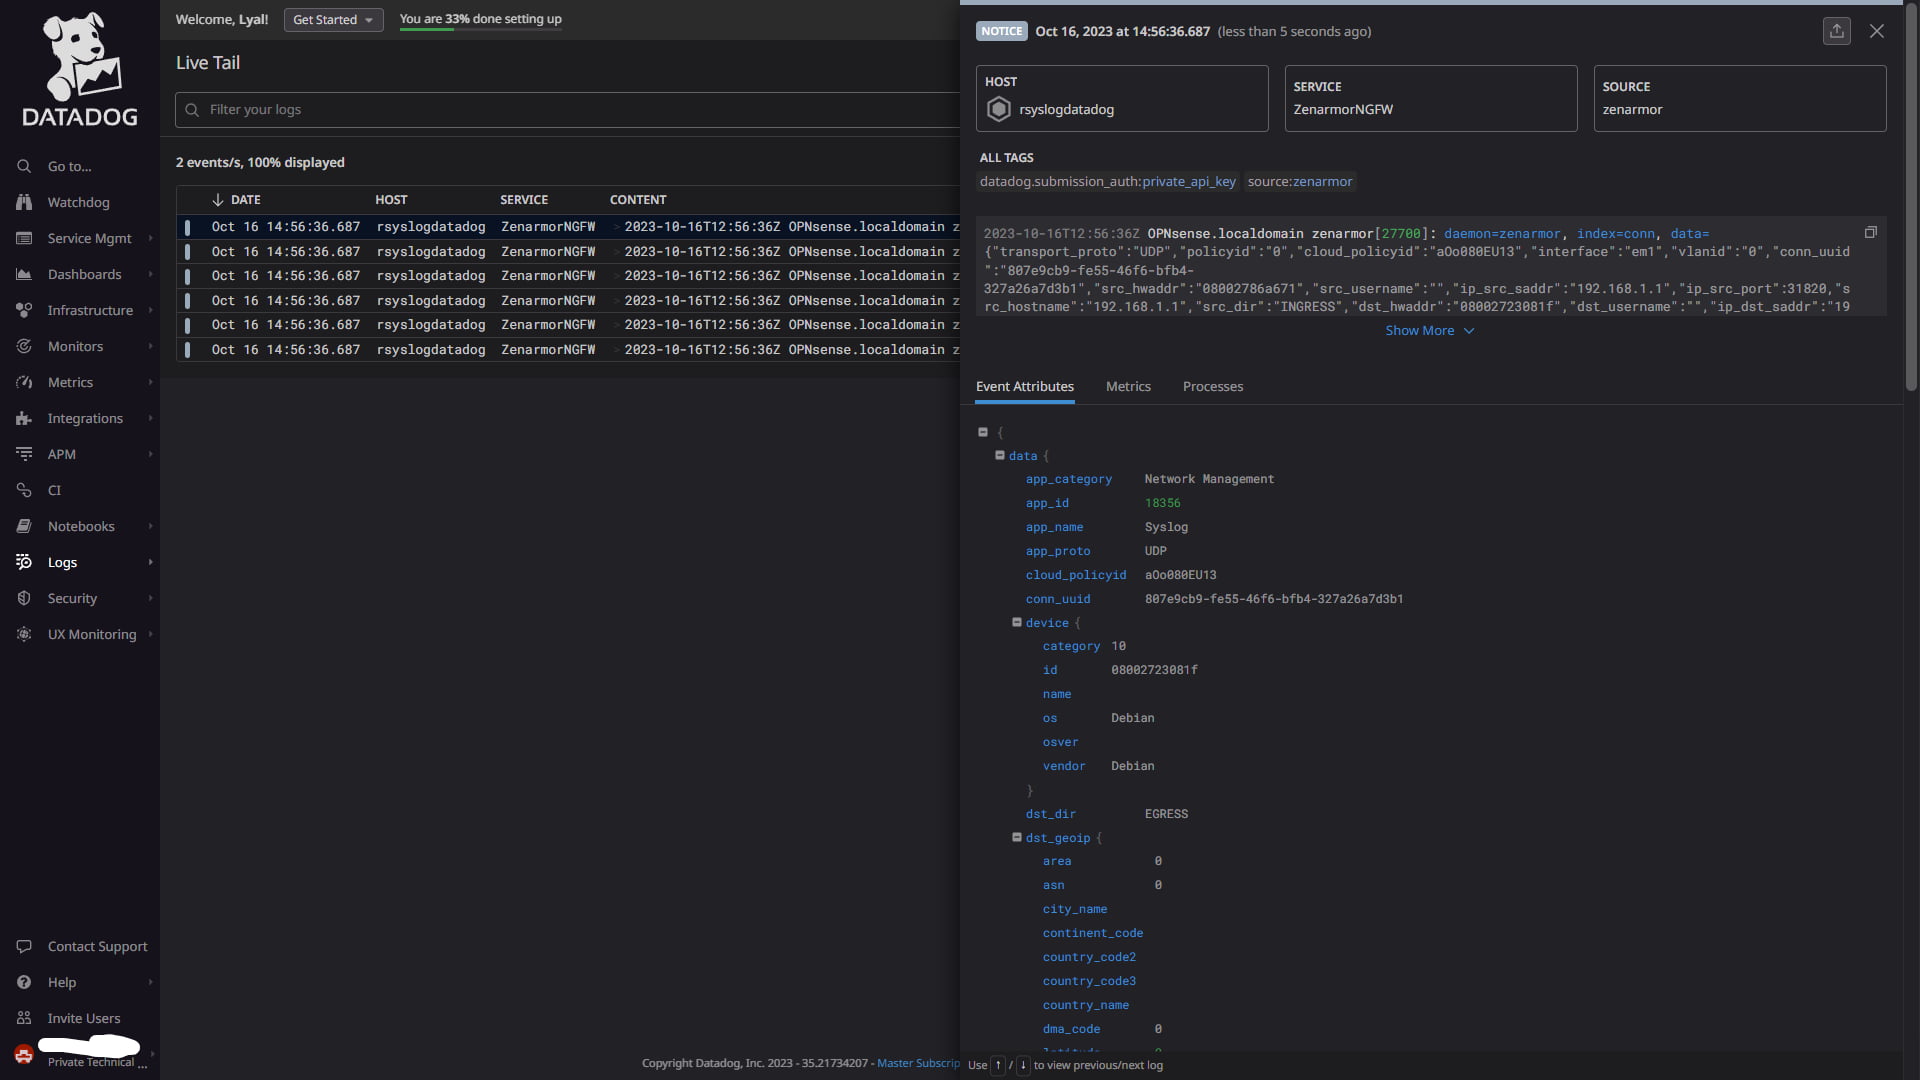
Figure 10: Example of a completed Grok processor matching the Zenarmor log sample and correctly parsing the JSON data so that those attributes can be used within Datadog
Your Zenarmor syslog event data can now be properly queried, and you can use it to create dashboards, alerts, etc. The choice is yours!
Wrapping things up
Zenarmor creates a wealth of accurate and actionable log data while protecting your network traffic, which is highly useful to SOC analysts and enables them to better detect, investigate, and respond to threats in your environment.
If you are an MSSP or a business that uses Datadog and Zenarmor, I highly encourage you to try this integration. Can you really afford not to be collecting this log data from Zenarmor?
If you are new to Zenarmor and are exploring all its enterprise capabilities, you can get started by signing up for a 15-day free trial