In the world of cybersecurity, having a robust and efficient Security Information and Event Management (SIEM) system is crucial. SIEM systems provide real-time analysis of security alerts generated by applications and network hardware. In this guide, we will explore how to integrate Zenarmor, a powerful network security solution, with Wazuh, a free and open-source SIEM and XDR solution, using the easy-to-configure Syslog event messages automatically generated by Zenarmor, for seamless and efficient security incident management.
Step 1: Enabling Syslog streams in the Zenarmor dashboard
In order to allow Zenarmor to send syslog event messages to the Wazuh syslog server we first need to point Zenarmor to the Wazuh syslog server. In the Zenarmor dashboard, you can find these settings under the Data Management menu. You will then need to input your Wazuh server address, and port and select the protocol as well as select which Syslog event messages you want to send to Wazuh, in this case, I chose to just send connections, however, there are other options available like Web, DNS, TLS and Alerts to choose from.
Just a side note, by default, Syslog servers usually listen on port 514 over UDP or 601 over TCP, I chose to use port 513 over TCP for this guide because, at the time of writing this, I was testing an alternative Syslog server using the default ports on the same box, so please do keep that in mind as yours will vary.

Figure 1: Point Zenarmor to the Wazuh server listening on port 513 and set up the indexes to include all connections, once done click Update.
Step 2: Configure Wazuh to listen for the Zenarmor Syslog streams
In order to enable the Syslog server in Wazuh, we need to make a quick amendment to the ossec.config.
To do this, navigate to the menu and go to Wazuh -> management -> Configuration and then click the “edit configuration” button top right. You can edit the ossec.conf directly in the browser.
Add the below snippet of XML code to the document. In my case, I am setting the port to listen on 513/TCP and only allowing connections from the 192.168.1.0/24 subnet, however, this will vary depending on how you choose to set this up for your environment. Once done, click the save button and restart the Wazuh manager for the changes to apply.
<remote>
    <connection>syslog</connection>
    <port>513</port>
    <protocol>tcp</protocol>
    <allowed-ips>192.168.1.0/24</allowed-ips>
  </remote>
Figure 2: XML code that you need to add to the ossec.config to enable the syslog server
The final config should like something similar to the screenshot below.
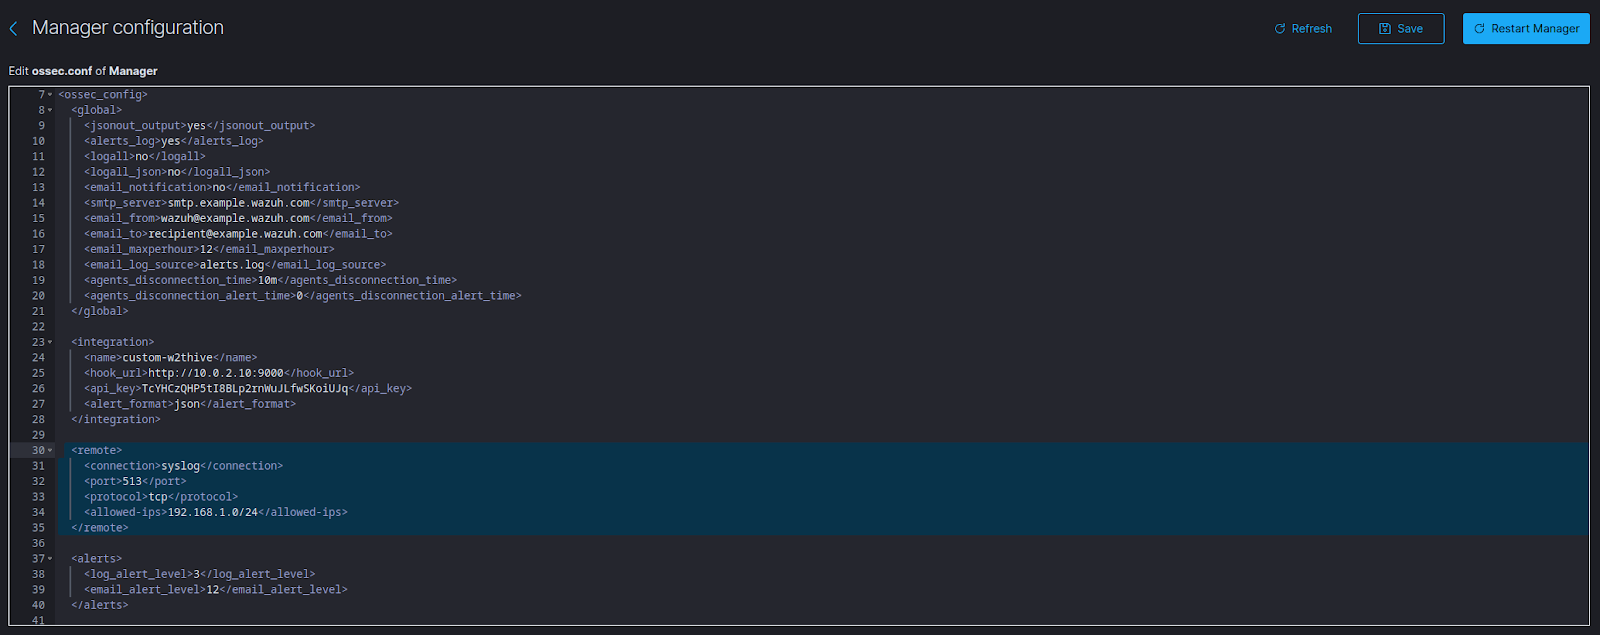
Figure 3: Image of the final configuration.
Step 3: Set up a custom Wazuh decoder to ingest the Syslog messages originating from Zenarmor
By default, Wazuh comes with an impressive collection of predefined decoders and rules, however, Zenarmor is not included in the collection yet, so we need to supply our own custom-made decoder and rules.
Just a quick explanation of how Wazuh log data collection works, the Wazuh manager collects the logs, like in our case using Syslog, however, it can also do this using an agent running on the endpoints. It then goes through a 3-step analysis process which is pre-decoding, decoding, and rule matching.
The pre-decoding phase extracts the timestamp, application name, and hostname from the syslog message. Once the application has been identified the actual decoding phase begins where the decoder extracts defined fields from the log like IP addresses, usernames, etc. The final phase is the rule-matching process where we configure rules to match and compare the defined fields decoded in the previous setup to decide if an alert needs to be created or not. This will make more sense when I show you the setup process in the following steps.

Figure 4: Illustration of how events flow through the Wazuh environment
To create the custom Zenarmor decoder, navigate to the menu and go to Wazuh -> management -> Decoders, and then on the extreme right select “custom decoders.”

Figure 5: Custom decoders menu in Wazuh dashboard.
Next, select the “add new decoders file” option top right and include the below custom Zenarmor decoder in the space provided.
Don’t forget to click save and restart the Wazuh manager to apply the decoder. While you are building custom decoders or rules there is an option to test the decoder or rule, which comes in handy, to make sure everything is working as expected, you can do this by selecting the button top right.
<decoder name="zen-dec">
    <prematch>zenarmor</prematch>
</decoder>
<decoder name="zen-conn">
    <parent>zen-dec</parent>
    <prematch>data=</prematch>
    <plugin_decoder offset="after_prematch">JSON_Decoder</plugin_decoder>
</decoder>
Figure 6: Custom Zenarmor decoder XML for pre-decoder and decoder phases.
The above code creates the “zen-dec” pre-decoder that does a prematch check for the Syslog message generated by Zenamor that includes the application name, “zenarmor” and timestamp in the message.
The main decoder is created called “zen-conn” which does another prematch check for the section of the syslog message called “data=” in order to extract the JSON formatted data sent from Zenarmor.
The <plugin_decoderoffset=”after_prematch”>JSON_Decoder</plugin_decoder> line triggers the built-in Wazuh JSON_Decoder and decodes all the JSON data included in the syslog message.
Below is a sample of the syslog message generated by Zenarmor. Note that Zenarmor includes all the data about the connection event in JSON format after the “date={” section of the log. The decoder that was created above extracts the JSON key-value pairs. The value in this log that we are most interested in is the “security_tags”, because we will be using this value to match on in the ruleset we will create in the next step. Other values that are important are “dst_hostname”, “ip_src_saddr”, “ip_dst_saddr” etc. which are vital bits of information when analyzing security events.
2023 Aug 08 11: 58: 19 wazuh-server->192.168.1.1 2023-08-08T11: 58: 19Z OPNsense.localdomain zenarmor[
            88886
        ]: daemon=zenarmor, index=conn, data={
            "transport_proto": "TCP",
            "policyid": "0",
            "cloud_policyid": "",
            "interface": "em1",
            "vlanid": "0",
            "conn_uuid": "f173c487-70cb-4d28-bd79-476b9d30ab4d",
            "src_hwaddr": "080027530cba",
            "src_username": "",
            "ip_src_saddr": "192.168.1.101",
            "ip_src_port": 49812,
            "src_hostname": "192.168.1.101",
            "src_dir": "EGRESS",
            "dst_hwaddr": "08002786a671",
            "dst_username": "",
            "ip_dst_saddr": "104.18.2.35",
            "ip_dst_port": 443,
            "dst_hostname": "pub-eaa055c05628483597a71842df6e52c9.r2.dev",
            "dst_dir": "INGRESS",
            "is_blocked": 1,
            "is_local": 0,
            "input": 7,
            "output": 7,
            "src_npackets": 17,
            "src_nbytes": 5051,
            "src_pbytes": 4133,
            "dst_npackets": 24,
            "dst_nbytes": 6544,
            "dst_pbytes": 5248,
            "src_tcp_flags": "APF",
            "dst_tcp_flags": "AP",
            "start_time": 1692188090000,
            "end_time": 1692188090000,
            "encryption": "TLS",
            "app_id": 10,
            "app_proto": "HTTPS",
            "app_name": "Secure Web Browsing",
            "app_category": "Secure Web Browsing",
            "tags": [
                "Phishing", "Encrypted", "SSL", "SSL V3", "Web Browsing"],
            "security_tags": ["Phishing"],
            "src_geoip": {
                "timezone": "",
                "continent_code": "",
                "city_name": "",
                "country_name": "",
                "country_code2": "",
                "country_code3": "",
                "dma_code": "0",
                "region_name": "",
                "region_code": "",
                "postal_code": "",
                "area": "0",
                "metro": "0",
                "asn": "0",
                "latitude": 0.0,
                "longitude": 0.0,
                "location": {
                    "lat": 0.0,
                    "lon": 0.0
                }
            },
            "dst_geoip": {
                "timezone": "",
                "continent_code": "",
                "city_name": "San Jose",
                "country_name": "US",
                "country_code2": "",
                "country_code3": "",
                "dma_code": "0",
                "region_name": "",
                "region_code": "",
                "postal_code": "",
                "area": "0",
                "metro": "0",
                "asn": "0",
                "latitude": 37.18349838256836,
                "longitude": -121.77140045166016,
                "location": {
                    "lat": 37.18349838256836,
                    "lon": -121.77140045166016
                }
            },
            "device": {
                "id": "080027d50e69",
                "name": "",
                "category": "10",
                "vendor": "Linux",
                "os": "Linux",
                "osver": ""
            }
        }
Figure 7: Sample of the syslog event message created by Zenarmor sent to Wazuh for decoding and rule matching.
Step 4: Set up a custom Wazuh rule to create an alert based on what Zenarmor has blocked
The final step in the Wazuh analysis process is to create a ruleset to match important fields or values that we decoded in the previous step.
To create the rule, navigate to the menu and go to Wazuh -> management -> Rules and then on the extreme right select “custom rules”.
Figure 8: Wazuh dashboard custom rule creating menu.
Next, select the “add new rules file” option top right and include the below custom Zenarmor rule in the space provided:
<group name="zenarmor,">
    <rule id="100011" level="0">
        <decoded_as>zen-dec</decoded_as>
        <description>Zenarmor Log</description>
        <options>no_full_log</options>
    </rule>

    <rule id="100012" level="3">
        <if_sid>100011</if_sid>
        <field name="security_tags">"Phishing"</field>
        <description>Zenarmor blocked a connection: Category - Possible Phishing attempt</description>
        <options>no_full_log</options>
    </rule>

    <rule id="100013" level="3">
        <if_sid>100011</if_sid>
        <field name="security_tags">"Hacking"</field>
        <description>Zenarmor blocked a connection: Category - Possible Hacking attempt or Hacking tool site access</description>
        <options>no_full_log</options>
    </rule>

    <rule id="100014" level="3">
        <if_sid>100011</if_sid>
        <field name="security_tags">"Malware"</field>
        <description>Zenarmor blocked a connection: Category - Possible Malware attempt or Malware tool site access</description>
        <options>no_full_log</options>
    </rule>

    <rule id="100015" level="3">
        <if_sid>100011</if_sid>
        <field name="security_tags">"Proxy"</field>
        <description>Zenarmor blocked a connection: Category - Possible Proxy access</description>
        <options>no_full_log</options>
    </rule>
</group>
Figure 9: Custom Zenarmor ruleset XML for rule matching phase.
A breakdown of the rule structure is as follows:
- group: The group of applications that these rules apply to, in this case, Zenarmor. The group tags must always be defined to make this ruleset valid or Wazuh will generate error messages.
- rule id: Each rule needs a unique rule id, for custom rules, these can be between 100000 and 120000.
- decode_as: This is where we call the decoder that we set up in the previous step.
- level: This is the Wazuh alert level that is given ranging from 1-15, Wazuh by default only creates alerts for level 3 and above.
- description: This is where you provide a brief description or reason that will be displayed when the alert is created/triggered.
- if_sid: This points back to the parent rule, in this case, 100011, that checks if the syslog message comes from the Zenarmor decoder.
- field name: This is the name of the data we want to look for inside the decoded JSON data from Zenarmor, in this case, we are checking for the various security tags or categories that Zenarmor uses to classify the traffic type e.g. hacking, proxy, phishing, etc. as a reason for blocking the connection. You can search for patterns here using regular expressions and keywords.
- options: These are additional rule options, more info about this here: https://documentation.wazuh.com/current/user-manual/ruleset/ruleset-xml-syntax/rules.html#rules-options
Basically, the above ruleset firstly checks for decoded events that originate from Zenarmor. The children rules ranging between 100012 to 100015 respectively match the extracted security tags, in this case, we are looking for “Phishing”, “Hacking”, “Malware”, and “Proxy.” There are plenty of other security tags you could match, however, to keep things simple we will work with the ones mentioned above. If one of these security tags is matched, a level 3 alert is created with the description e.g. “Zenarmor blocked a connection: Category – Possible Phishing attempt” and the alert is injected into the Wazuh alert feed for further analysis.
While this ruleset is fairly simple, I encourage you to have a look at the rules syntax in the Wazuh documentation, there are loads of additional tags and options to create some powerful rulesets if you wish.
Step 5: Observe the alerts created in Wazuh when blocked content is triggered by Zenarmor
In order to test that Zenarmor is blocking the phishing site and sending the Syslog message over to Wazuh, I have used PhishTank and taken a random verified phishing submission. You will see that when we attempt to view the phishing link, Zenarmor detects this connection and immediately blocks it from accessing the phishing website.
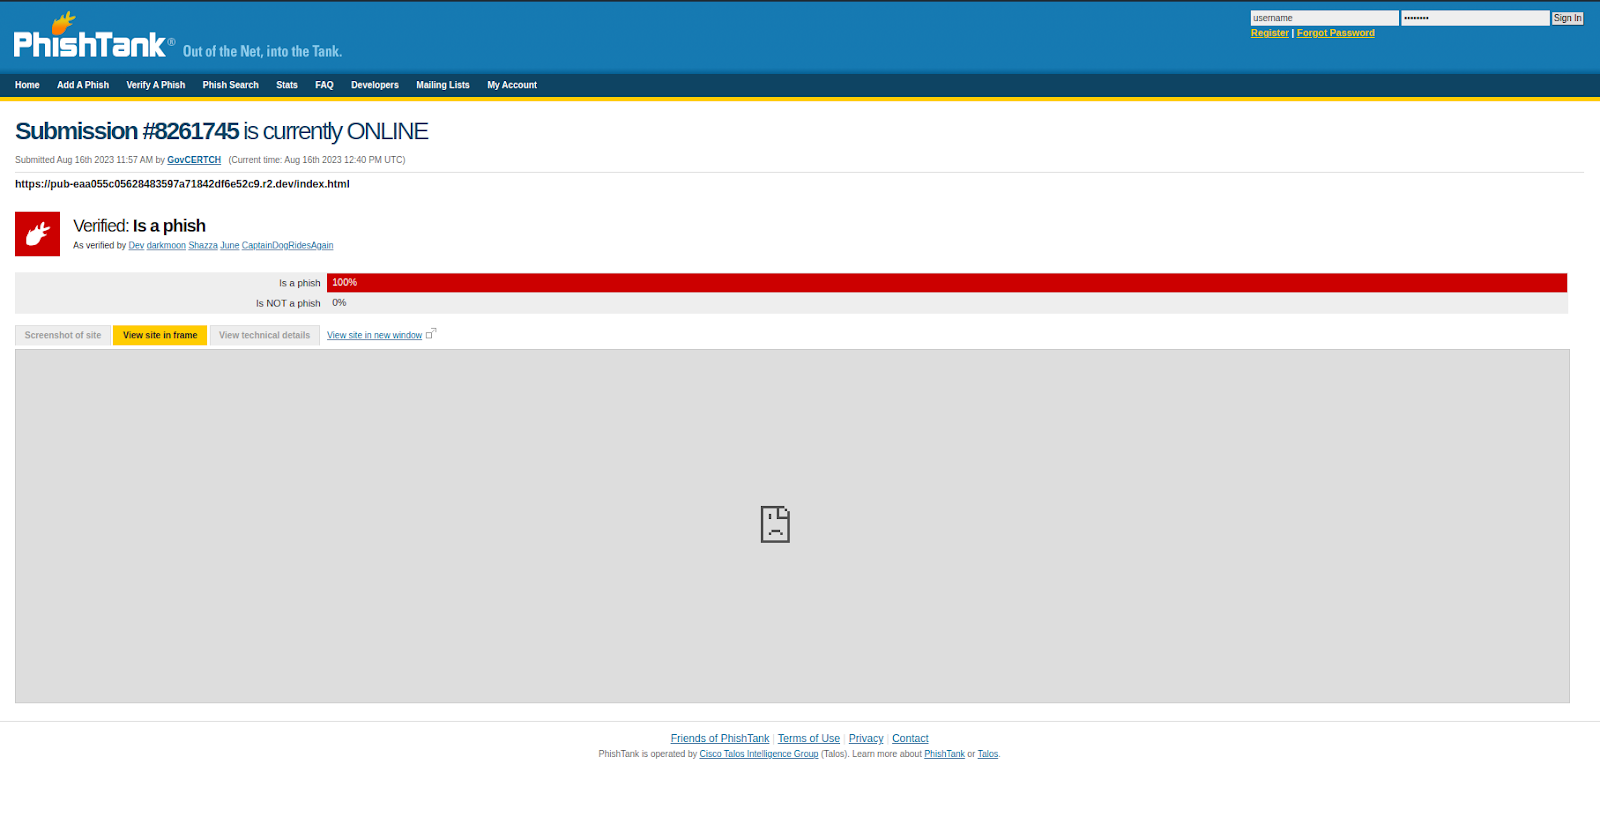
Figure 9: Attempting to view the phishing site is immediately blocked. Just a note, if you test this yourself be careful, these are active phishing sites, DONT interact or input any info.

Figure 10: Monitoring the live threat sessions in the Zenarmor dashboard built into OPNsense, showing the phishing site access attempts were blocked and tagged under the “security category” as “Phishing”
Moving over to Wazuh, if we navigate to Modules -> Security Events and we take a look at the Security Alerts feed section of the dashboard, we can see that Wazuh created the alerts for the phishing attempt based on the decoder and rules that were created earlier in the article, with all the information fed in via the syslog message.
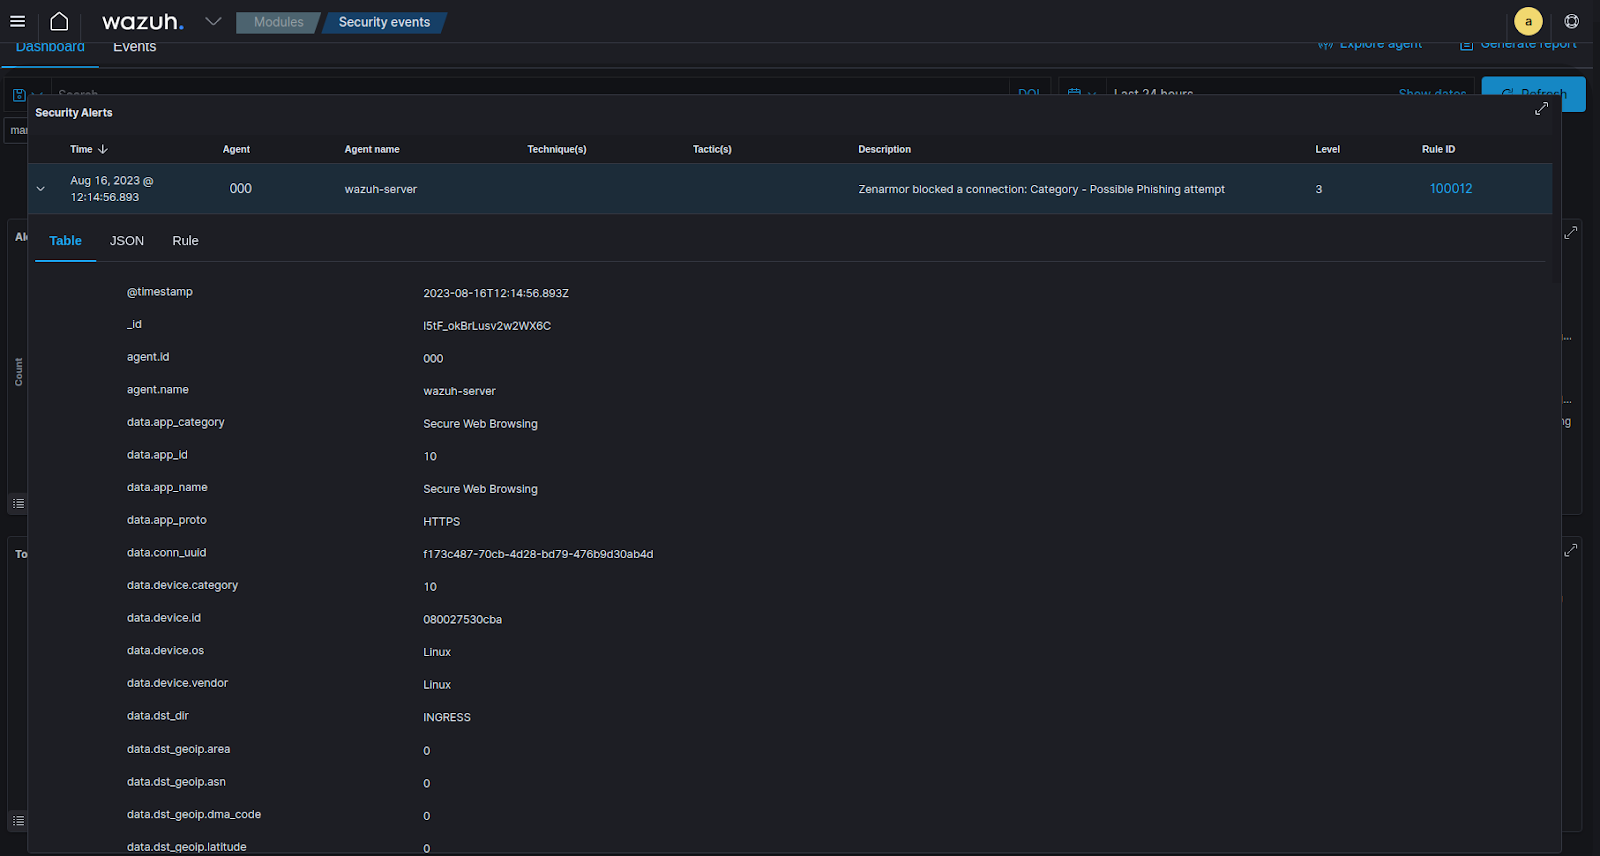
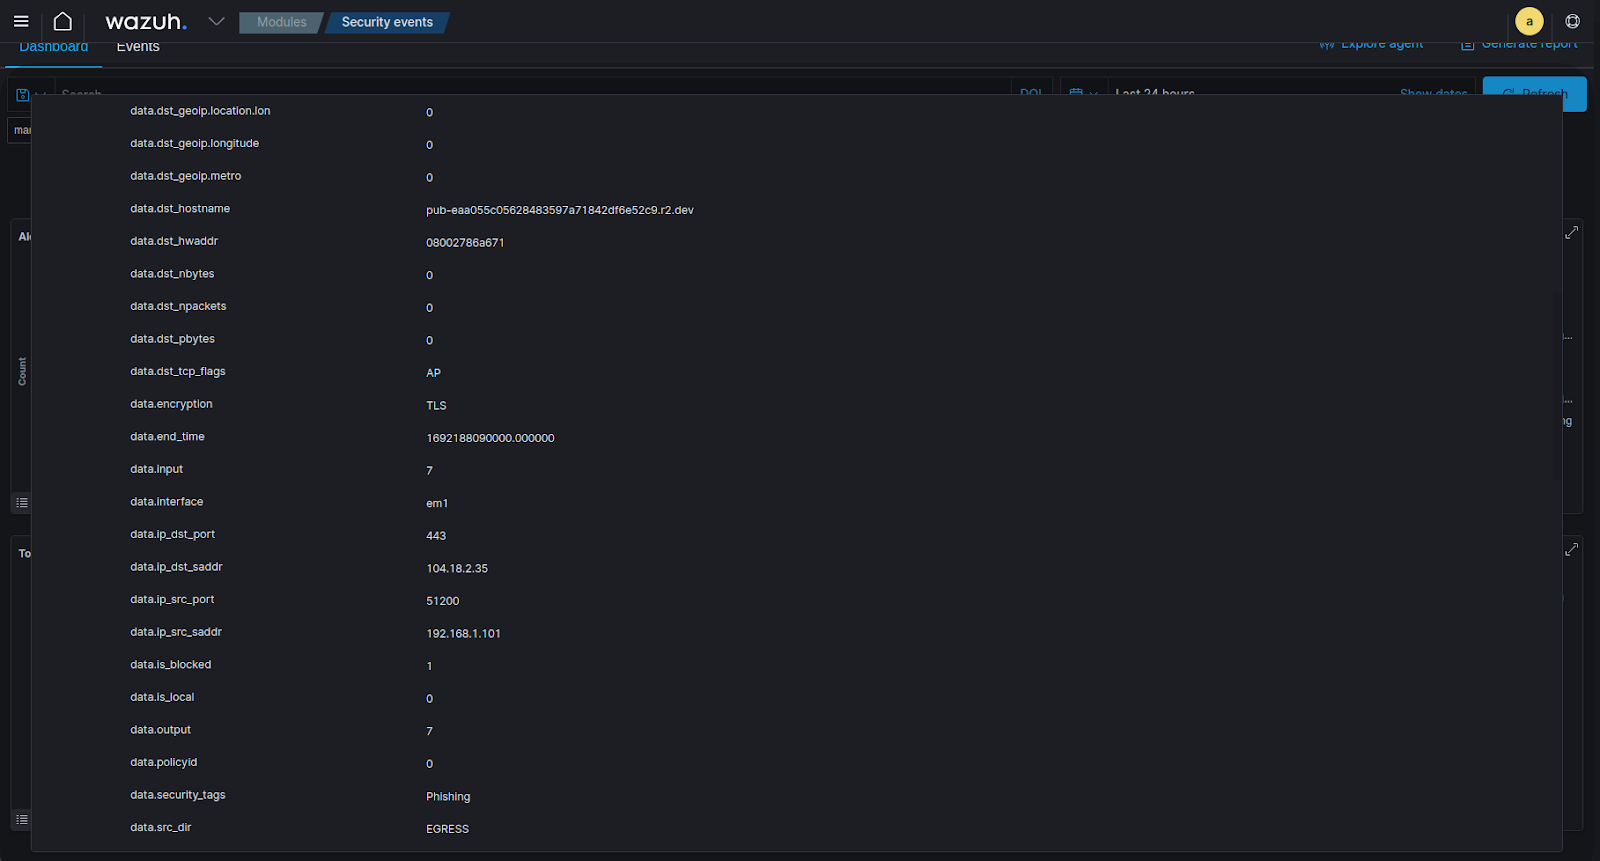
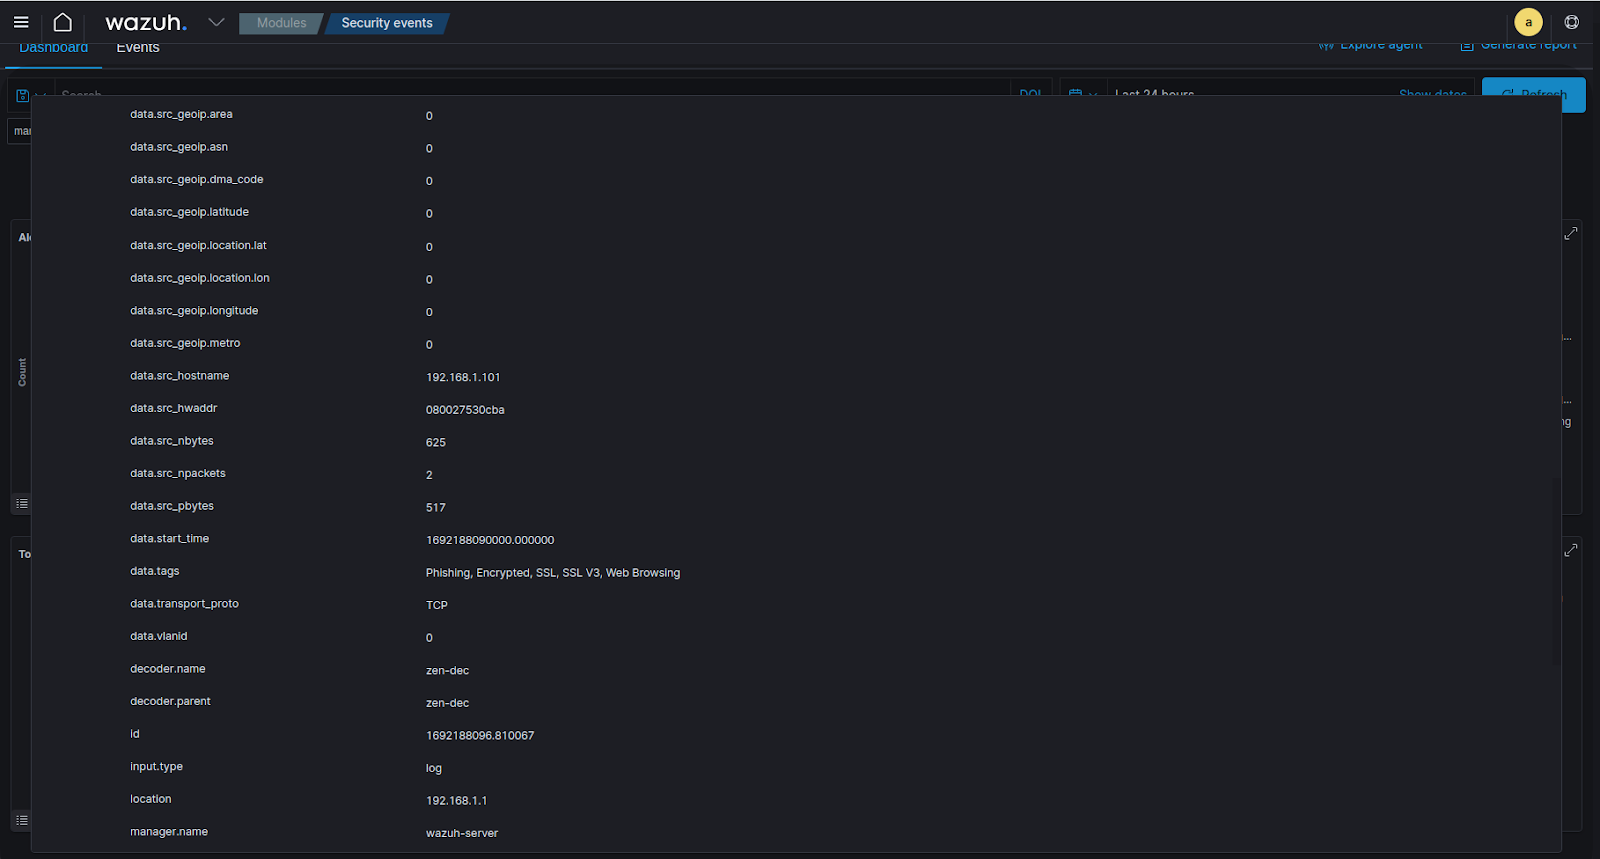
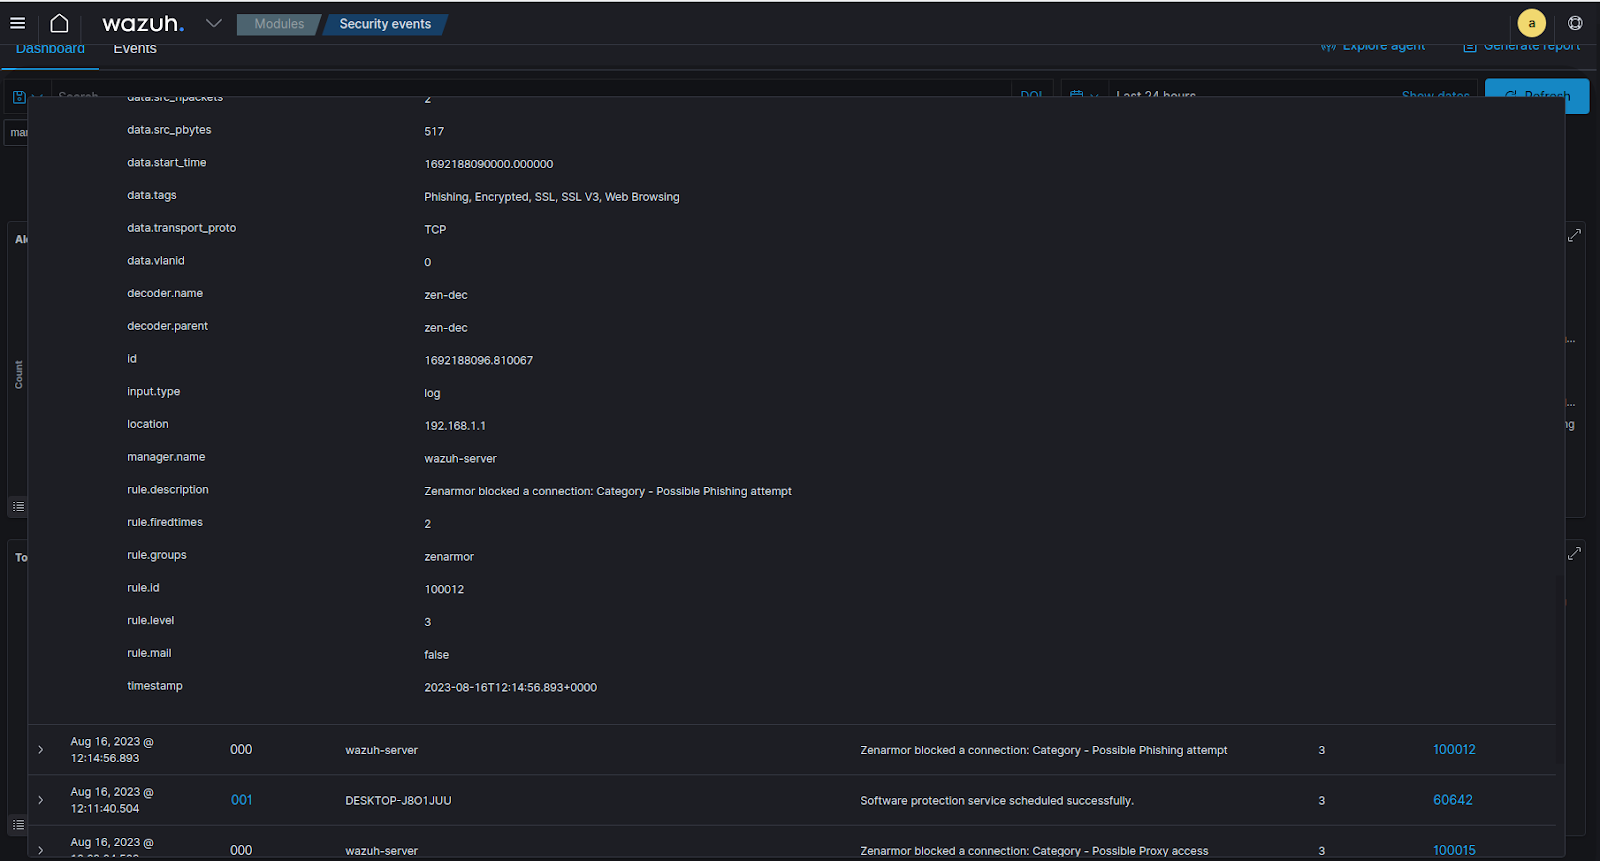
Figure 11: A view of the alert created in Wazuh, the most important info to consider would be source/destination IPs, security tags, destination hostnames/URLs etc. for further analysis.
So now that you have Zenarmor integrated with Wazuh, some further steps you could consider taking from here to get the most out of this integration are:
- Create a custom dashboard that uses and displays these alerts in a useful way.
- Correlate these alerts with others for example alerts created from Sysmon to give you a better overview of the potential threats across your network and endpoints.
- Integrate Wazuh with your Security Incident Response Platform like TheHive, where you can create and manage cases based on these alerts.
- Perform further testing and analysis of IOCs, observables, etc.
Final thoughts…
To wrap things up, you should now have a better understanding of how you can integrate Zenarmor with your SIEM of choice using Syslog. Syslog is a popular protocol used to send log messages and is supported by most if not all SIEM solutions so you are not just limited to using Wazuh like in the case of this article.
Zenarmor creates a wealth of accurate and actionable log information through its rigorous content filtering processes, which to be frank, you need to have captured by your SIEM solution to avoid missing out on the next big security threat.
If you are an MSP or business that wants to get the most out of your current Zenarmor and SIEM deployments, I highly encourage you to try this integration. If you are new to Zenarmor and exploring all its enterprise capabilities you can get started by signing up for a 15-day free trial.
Alternatively, feel free to contact Zenamor and ask for assistance getting your free trial set up and started today.