The ELK stack (Elasticsearch, Logstash, and Kibana), also known as the Elastic stack is a popular platform used by organizations to collect, search, analyze, and visualize data from any sources and in the context of cybersecurity can be used as a Security Information and Event Management (SIEM) solution with the correct integrations. Based on its popularity and the advantages it offers, it makes sense that enterprise-ready products like Zenarmor prioritize offering direct and easy integration to this platform.
Some benefits of integrating Zenarmor with your remote ELK stack are:
- You can easily stream all reporting data from all your Zenarmor deployments to a central location for safekeeping.
- By having all this data stored centrally, you can easily tap into it with your SIEM tools to quickly detect, investigate, and respond to potential threats.
- Elasticsearch by design is highly scalable and offers performance advantages over the alternative locally run database options you can use with Zenarmor like MongoDB and SQLite, and is the recommended database choice if you have a large network with many endpoints.
- By offloading the reporting data to a remote Elasticsearch database, you can essentially free up resources on your Zenarmor firewalls, especially those with limited storage resources, leaving them to do what they do best, filtering traffic, without having to worry about writing log data to disk.
If you have not already guessed, in this article, we are going to explore how to set up Zenarmor to offload and stream its log data to an ELK stack, so let’s get started.
Step 1: Setting up your ELK stack (Optional)
To get the most benefit out of this tutorial you are going to need a functioning ELK stack. If you already have ELK running you can skip this step and move to step 2. For those of you who don’t have ELK running and would still like to explore this integration in your lab environment, I have provided a docker-compose.yml configuration below that will provide a quick means to spin up Elasticsearch and Kibana using docker containers. All you will need is a machine or VM running docker and you will have an ELK stack deployed in a few minutes.
Just an important note here, in order to get Elasticsearch and Kibana spun up as quickly as possible, I have purposely disabled all the built-in security features that can tend to be a bit tricky to set up especially when you just want to explore the platform, and its functionality in your lab. Please DO NOT use this configuration for production environments for obvious reasons.
If you are interested in building a production-ready ELK stack using docker-compose you can check out the Elastic documentation and GitHub which I have included here for your convenience.
version: '3.8'
services:
    elasticsearch:
        container_name: zen-elasticsearch
        image: docker.elastic.co/elasticsearch/elasticsearch:8.9.1
        environment:
            - node.name=es-zen-lab
            - cluster.name=es-cluster
            - discovery.type=single-node
            - bootstrap.memory_lock=true
            #- ELASTIC_PASSWORD=${ELASTIC_PASSWORD}
            - xpack.security.enabled=false
            - "ES_JAVA_OPTS=-Xms512m -Xmx512m"
        ulimits:
            memlock:
                soft: -1
                hard: -1
        volumes:
            - es-data:/usr/share/elasticsearch/data
        ports:
            - 9200:9200
        networks:
            - docker_net

    kibana:
        image: docker.elastic.co/kibana/kibana:8.9.1
        container_name: zen-kibana
        environment:
            - ELASTICSEARCH_HOSTS=http://zen-elasticsearch:9200
            #- ELASTICSEARCH_USERNAME=${KIBANA_USER}
            #- ELASTICSEARCH_PASSWORD=${KIBANA_PASSWORD}
        ports:
            - 5601:5601
        networks:
            - docker_net

        # Disabled Logstash since we don't need it, however, this is where that config would go if you need to set this up.
        #  logstash:
        #    image: docker.elastic.co/logstash/logstash:8.9.1
        #    container_name: zen-logstash
        #    ports:
        #      - "5044:5044"
        #    volumes:
        #      - ./logstash/conf.d/:/usr/share/logstash/pipeline/:ro
        #    networks:
        #      - docker_net

        volumes:
        es-data:
            driver: local

        networks:
        docker_net:
            driver: bridge
Figure 1: Basic docker-compose.yml configuration to get Elasticsearch and Kibana running quickly with the security features disabled. Don’t use this in production environments
Step 2: Setting up Zenarmor to stream reporting data to your remote ELK stack
At this point in the tutorial, I assume that you already have your ELK stack operational and Zenarmor installed awaiting its initial configuration using the configuration wizard.
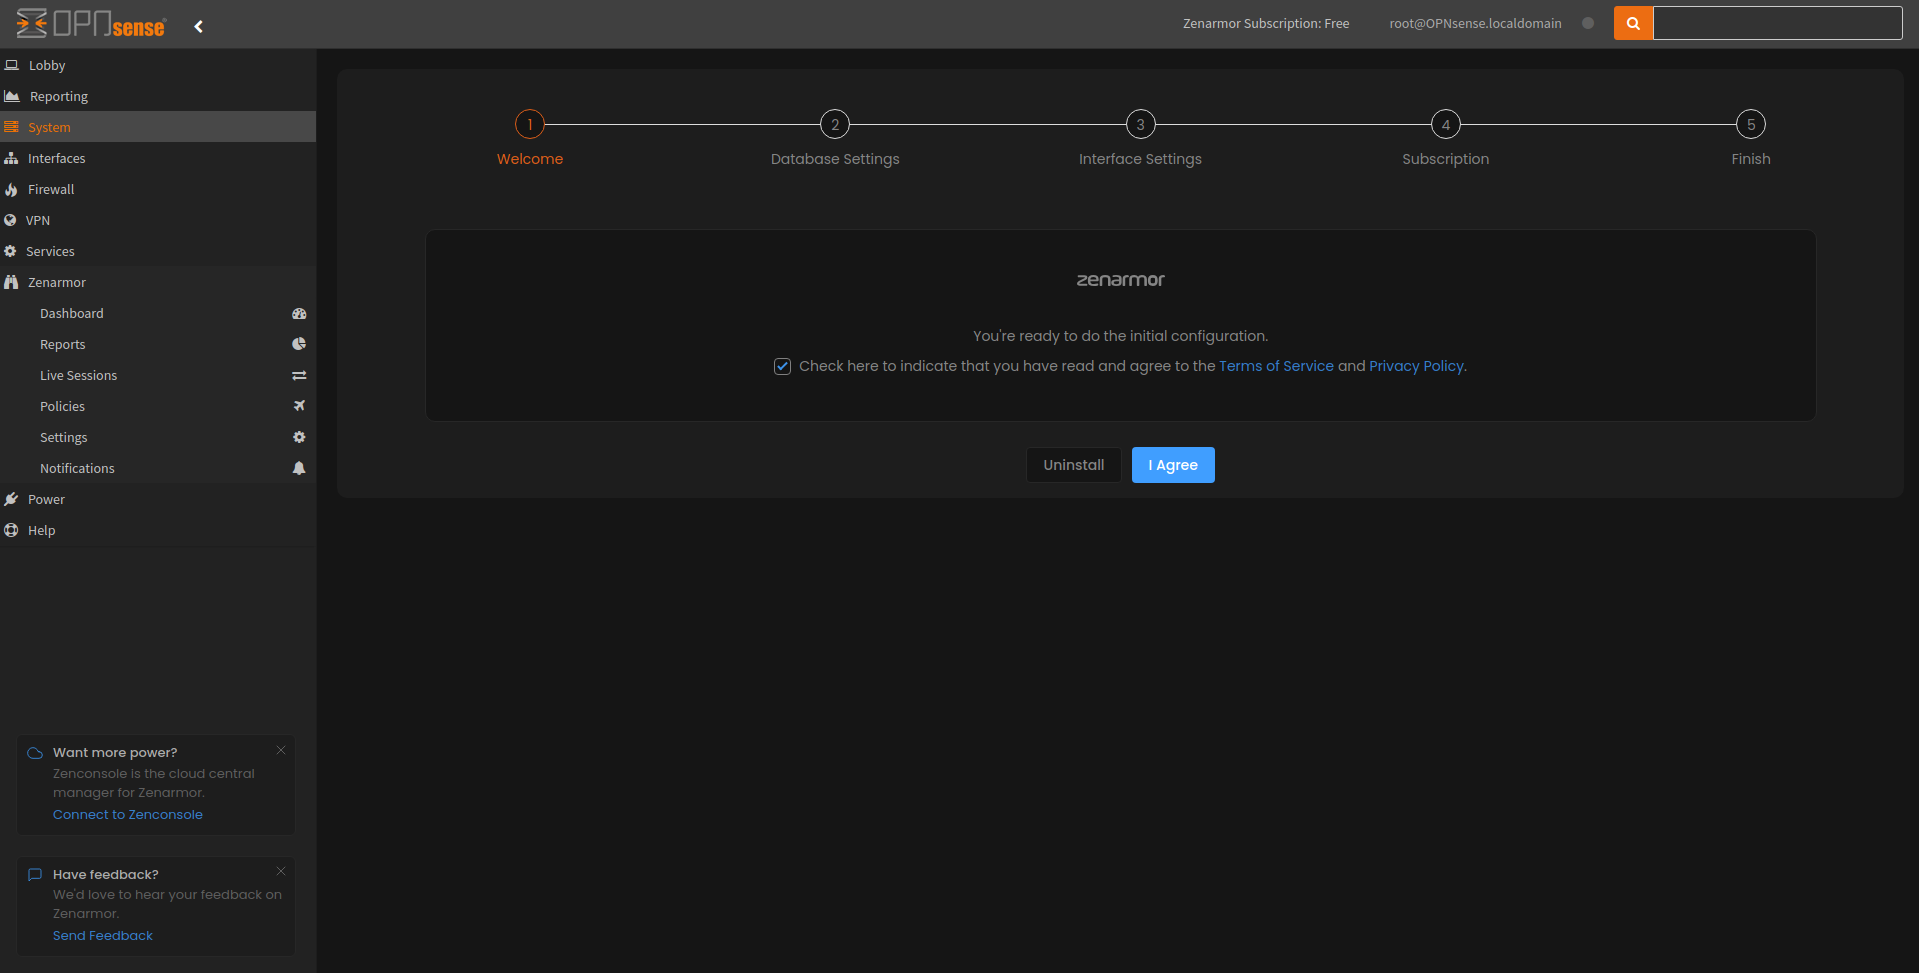
Figure 2: Zenarmor initial configuration wizard
Once you accept the terms and agree, the next part of the wizard prompts you to choose your database settings. Zenarmor has three recommended database options for you to choose from, two of which are MongoDB and SQLite which will be installed locally on your firewall and the third is a remote Elasticsearch option that we are going to select and configure.
The setup is straightforward, you need to supply the Elasticsearch database URL, in my case it’s http://192.168.1.104:9200 followed by a blank username and password. Just a few things to note here, because security has been disabled I am able to connect via HTTP to this service without a username and password, however, with security enabled you will be forced to use HTTPS. As for the username and password, it is recommended to use a dedicated services account for Zenarmor.
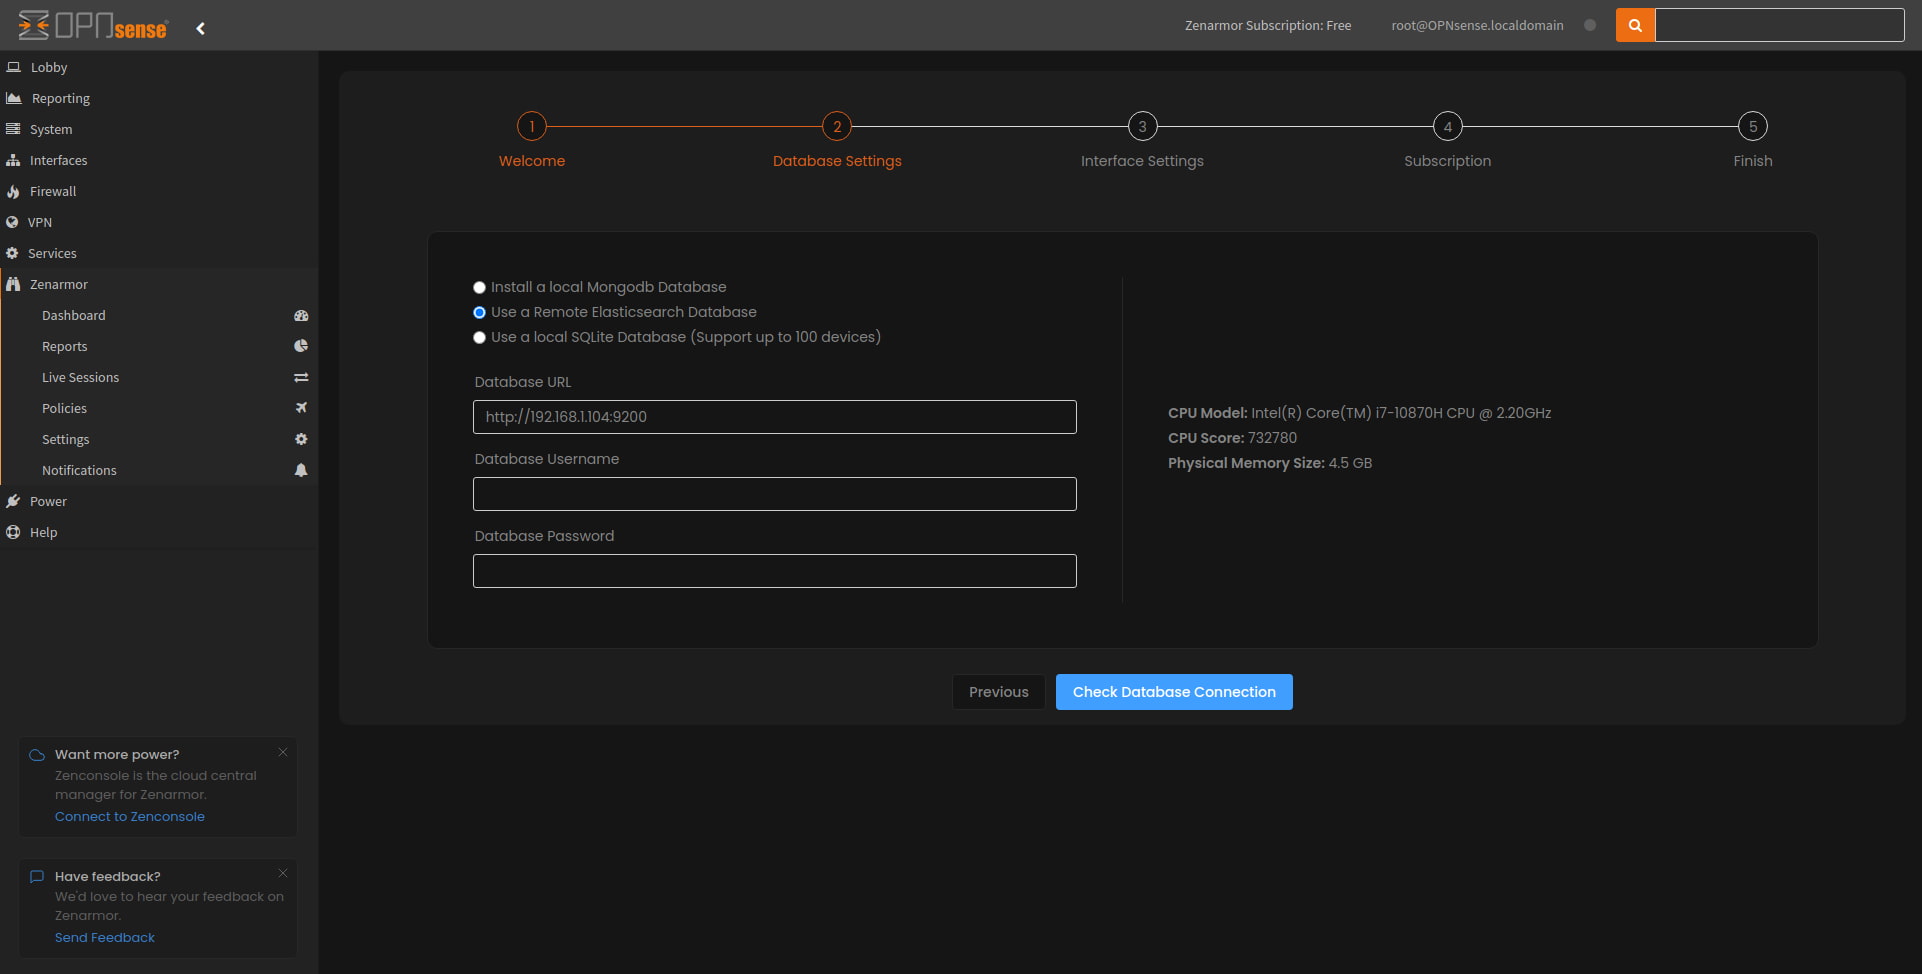
Figure 3: Zenarmor database settings wizard
You will need a SOHO subscription or above to be able to use a remote Elasticsearch database. If you don’t have a subscription and want to try this out, you can sign up for a 15-day business subscription for free, with no credit cards required.
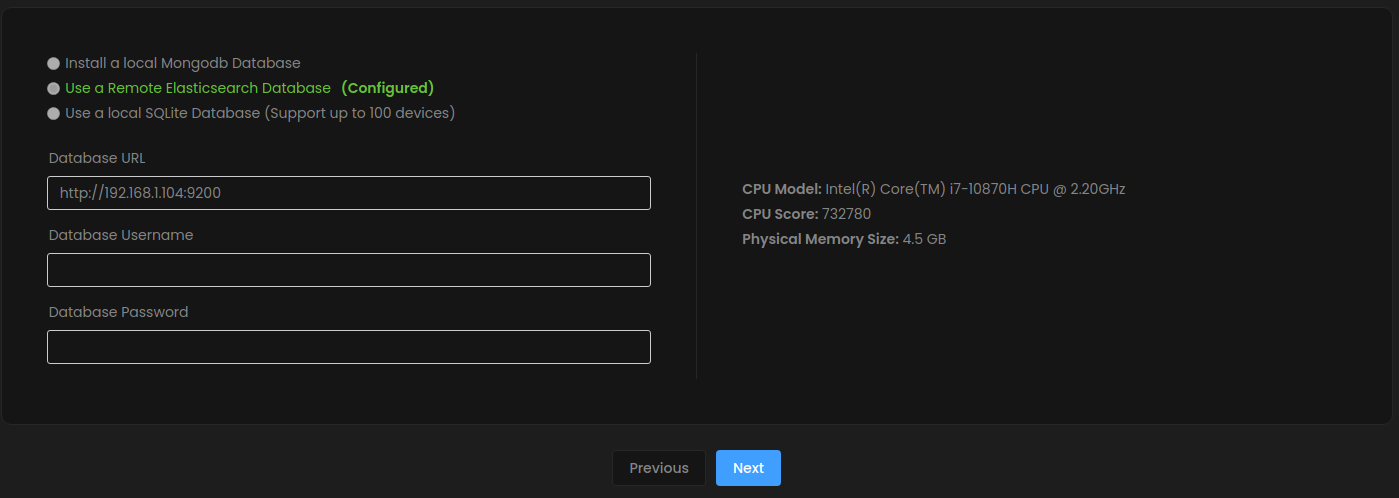
Figure 4: Zenarmor database wizard showing a successful connection to the remote Elasticsearch database highlighted in green.
If you have an existing Zenarmor installation configured you will have most likely noticed that you can’t change your existing database if you have selected one of the other local database options as described above. In this case, you will need to do a reinstallation of the Zenarmor reporting database.
If reinstallation is not an option, and you still need to stream the data logs generated by Zenarmor to a remote Elasticsearch database, you are still able to stream a copy of this data by enabling it in the Zenarmor settings under the “Data Management” menu following a similar process as described above.
As an alternative, you could consider using Syslog to stream this data to a remote Syslog server. If you are interested in learning how to do this, please have a look at a previous article that I wrote showcasing how to integrate Zenarmor with Wazuh, a popular open-source SIEM and XDR solution.

Figure 5: Zenarmor Data Management menu with the option to enable external Elasticsearch data streaming.
Step 3: Confirming that the indices have been created in Elasticsearch using the Kibana Management Dashboard
To confirm that Zenarmor is streaming reporting data to the remote Elasticsearch instance, you can check this by navigating to the Kibana dashboard, in my case, this is navigating to http://192.168.1.104:5601 using the browser. You will then need to use the menu on the left and select “Management” then select “Index Management”.
You should see that Zenarmor created 6 indices, Alerts, Conn, DNS, HTTP, SIP, and TLS with your machine’s unique identifier appended similar to what is seen in the image below.
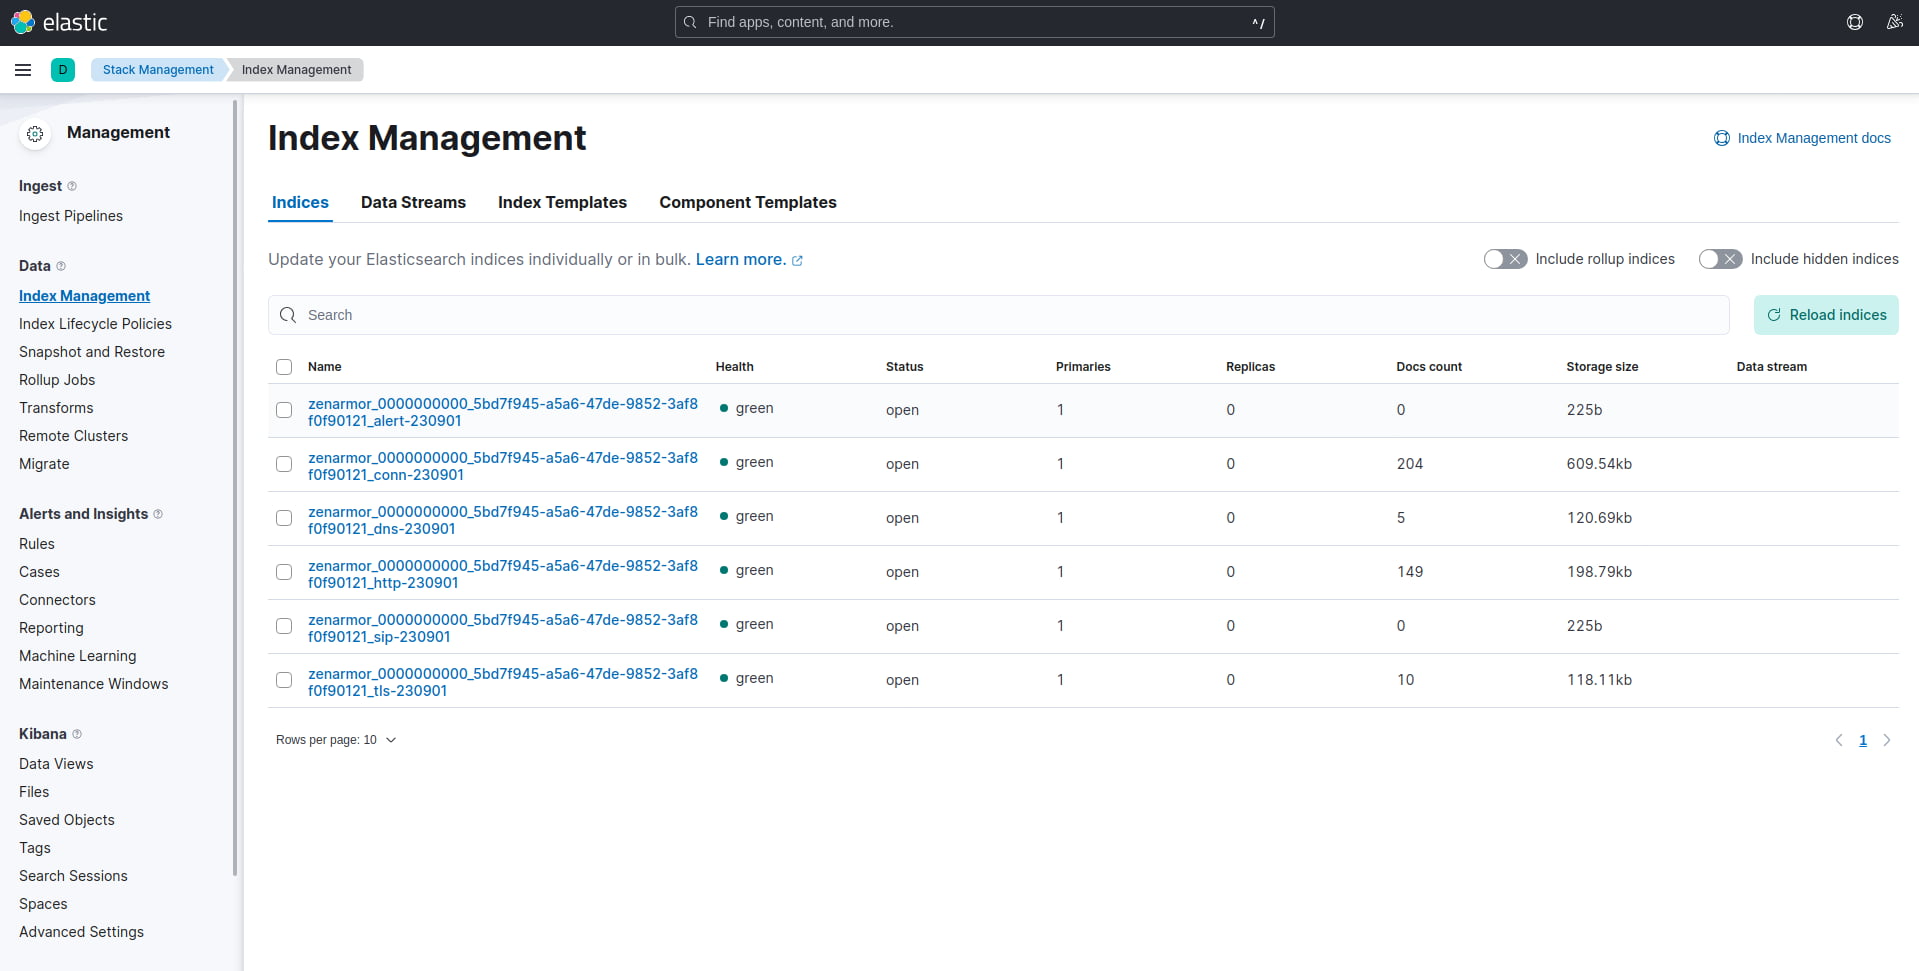
Figure 6: Kibana Index Management dashboard showing the 6 indices created by Zenarmor.
Step 4: Create a Data View using the Kibana dashboard
In order to make use of the Zenarmor data that we store in Elasticsearch, we need to create a data view to do so.
To do this, you will need to once again make use of the Kibana Management dashboard and select the “Data Views” option under the Kibana setting option similar to what is seen in the image below.
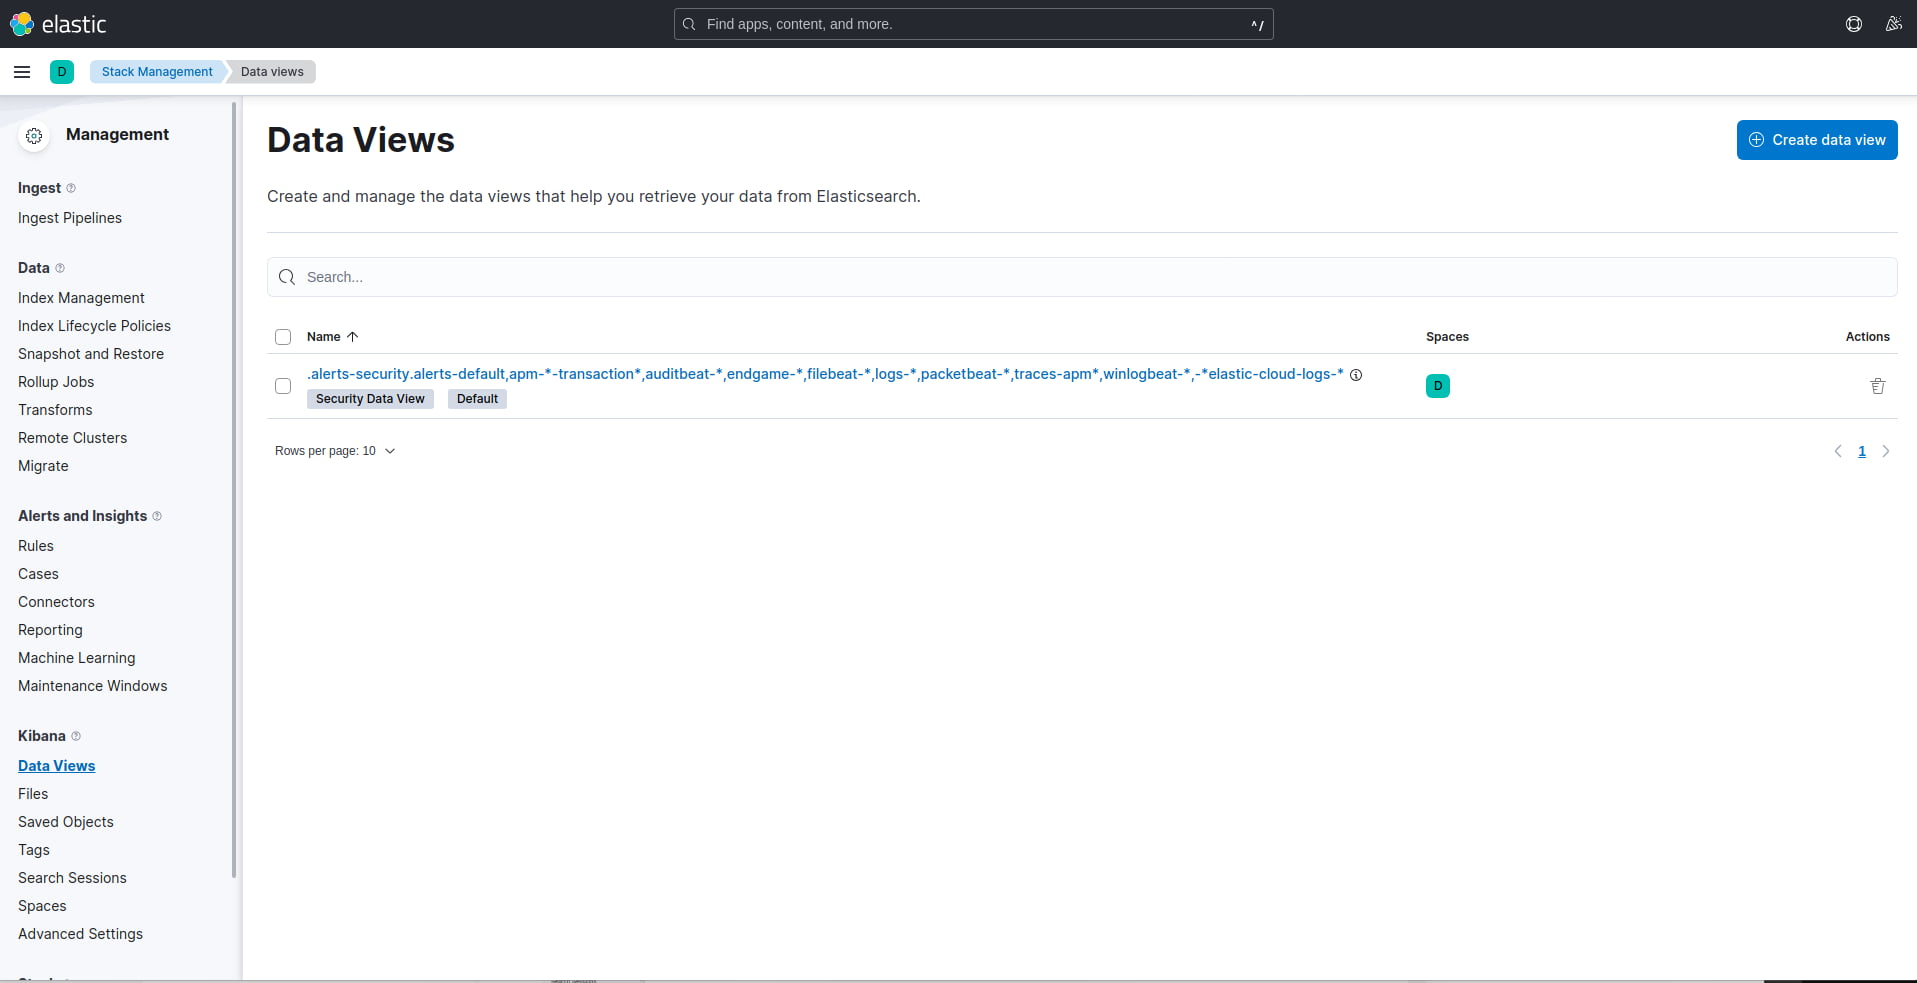
Figure 7: Kibana Data View dashboard.
Once in this dashboard, we need to create a new data view by clicking the “create data view” button top right. You should see a menu displayed that looks similar to the image below listing the Zenarmor indices to the right.
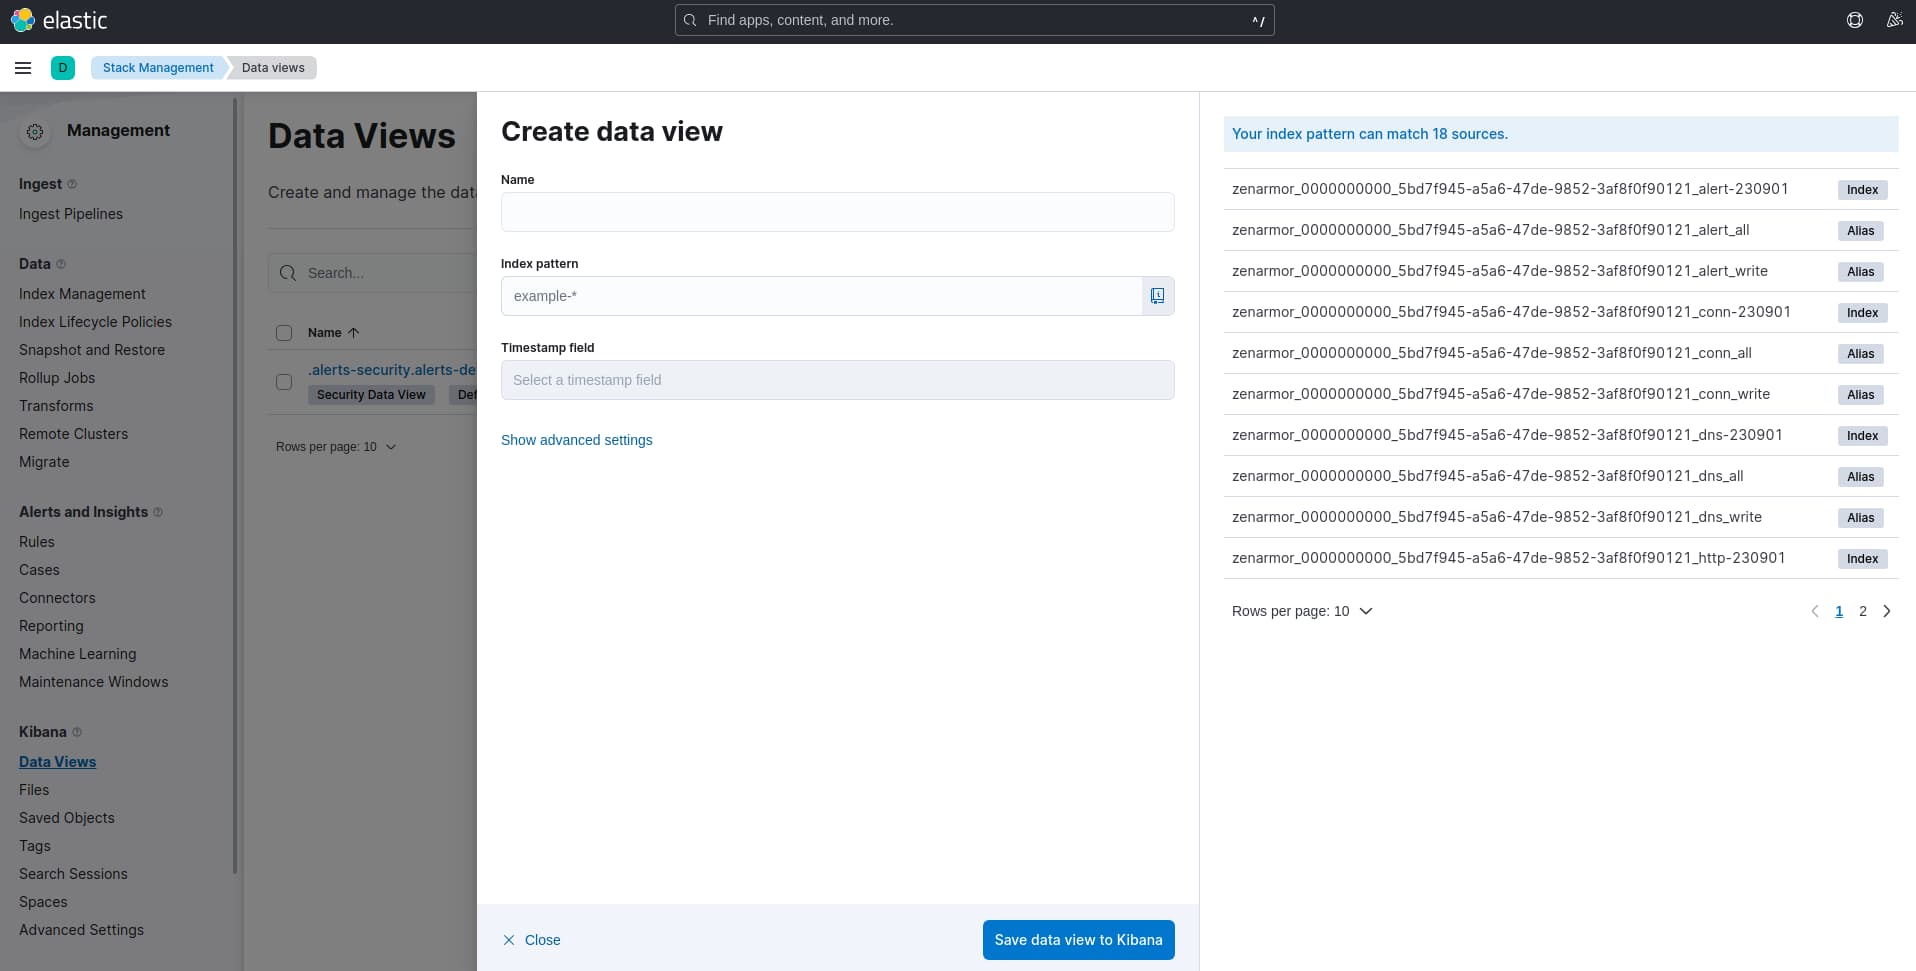
Figure 8: Create data view menu.
To create the data view you will need to provide a name of your choice, followed by the index pattern you wish to match. For this tutorial I have chosen to match all connections logged by Zenarmor, however, the choice is yours as to what data interests you. For the index pattern, I am matching on the “conn” index using the following pattern:
zenarmor_0000000000_5bd7f945-a5a6-47de-9852-3af8f0f90121_conn-*
This will be different in your case, the asterisk (*) applied at the end of the line is a wildcard to make sure that we match all future, subsequent dates as you will notice “230901” appended to the end of each index, like in this case, which is tracking the date.
As for the timestamp field, I have selected “start_time.” Once done click the “Save data view to Kibana” button at the bottom.
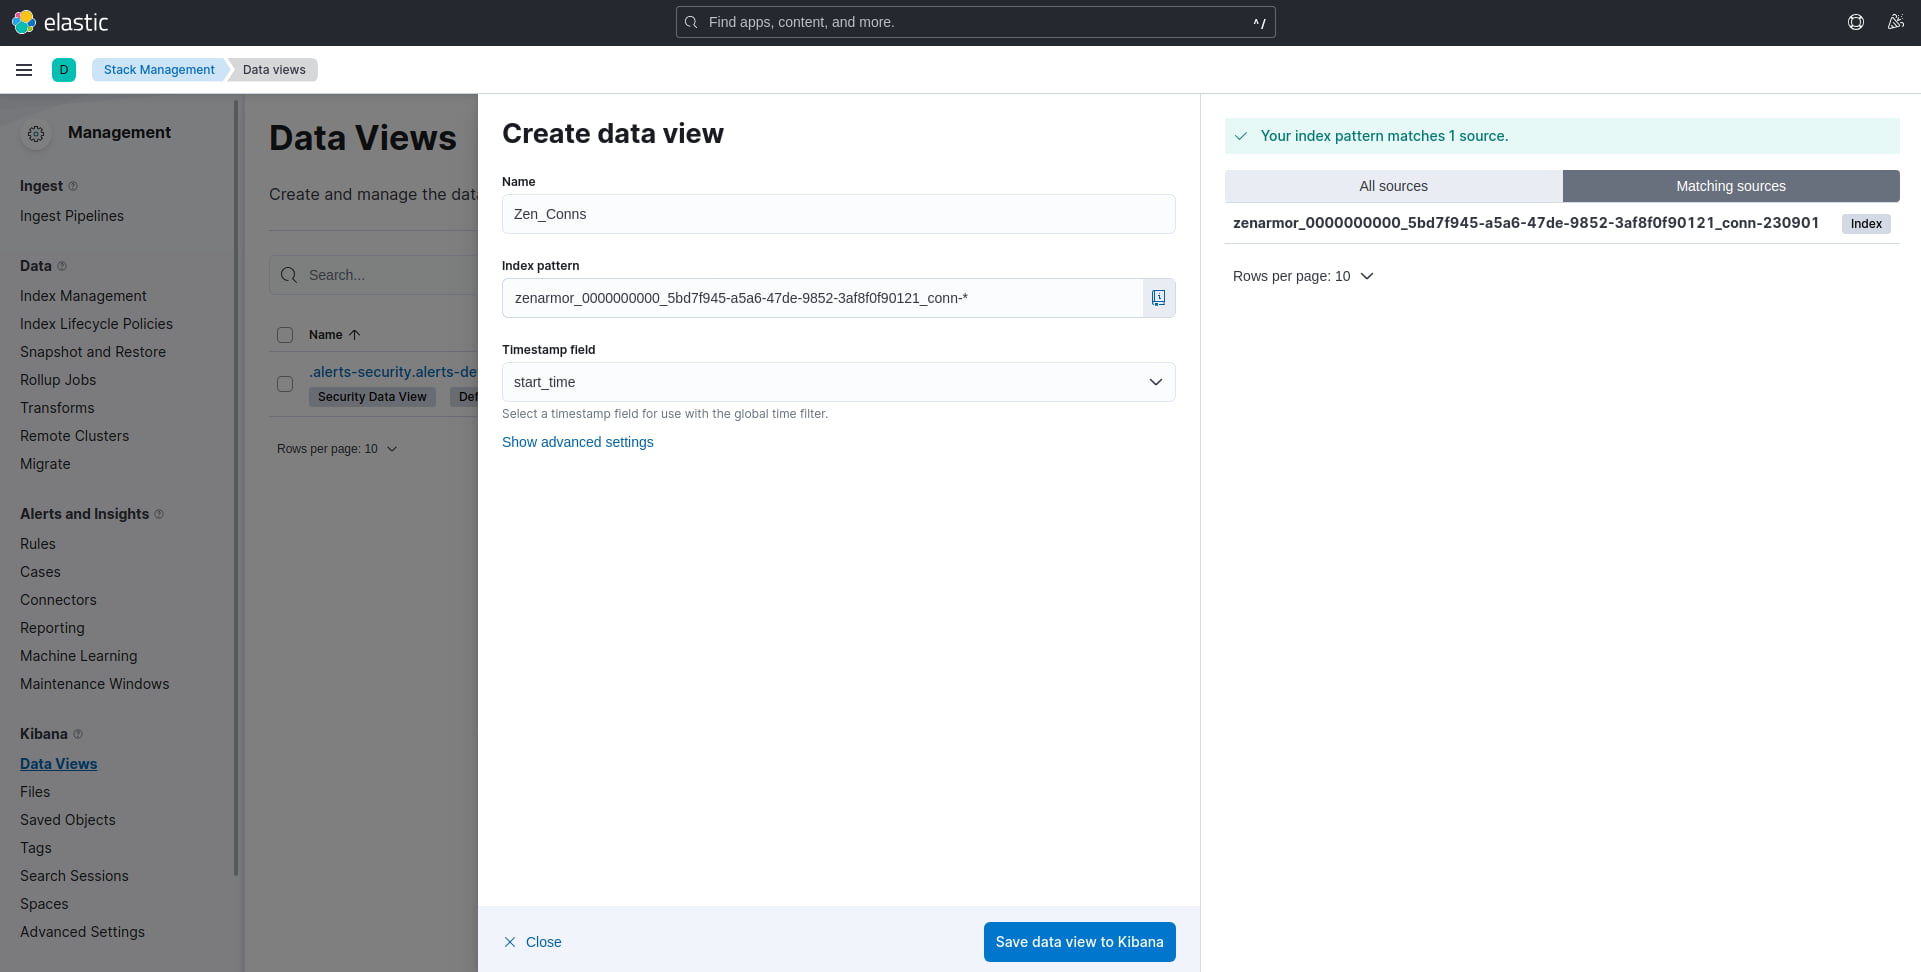
Figure 9: Data view creation menu including Name, Pattern, and Timestamp fields.
Once your data view has been created, Kibana will display an overview of all the fields extracted from the Elasticsearch database that you can now use to base your queries on and create visualizations and dashboards in Kibana.
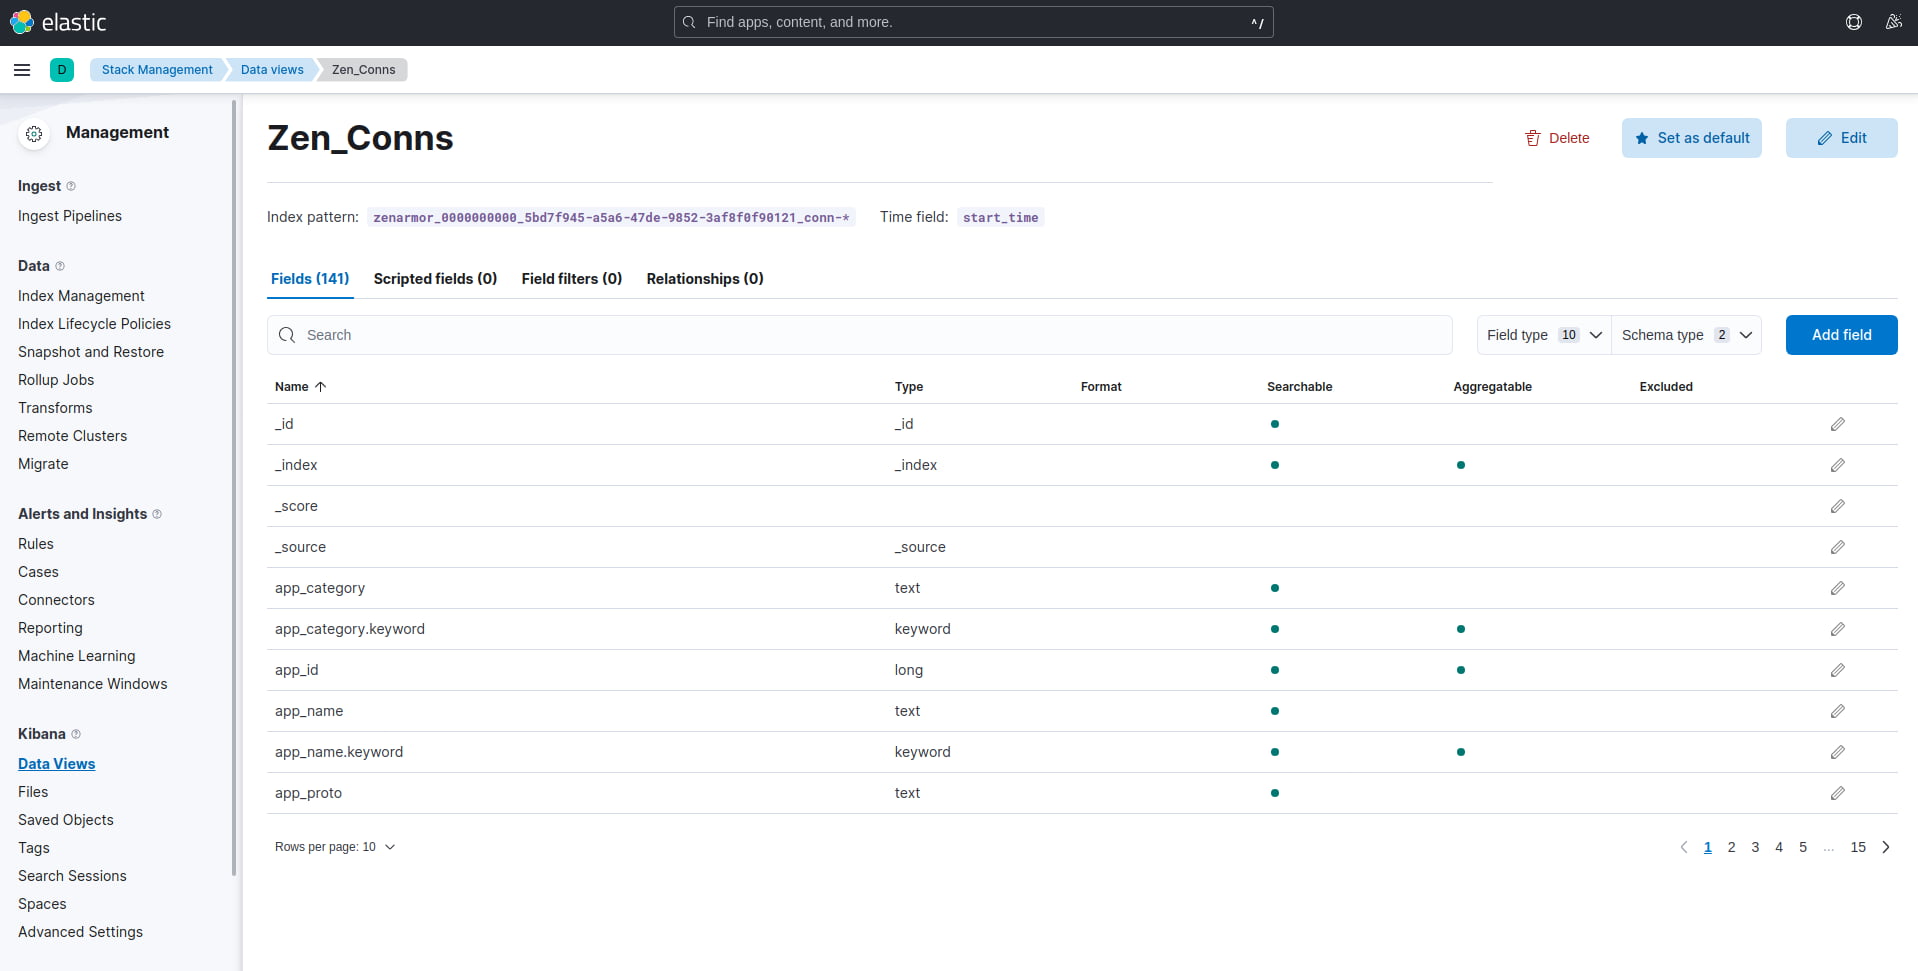
Figure 10: View of the available fields in the Zen_Conns Data View.
Step 5: Visualizing the Zenarmor connection data with Kibana
Now that we have set up a data view, the next step is to put it to use and create visualizations of your data. If you are new to Kibana or you would like to recap, it is basically a data visualization dashboard that allows one to explore and visualize data. In the case of cybersecurity, we use Kibana to build insightful dashboards based on the log data that is collected from devices and applications running on our networks. Elastic Security is a popular choice for many organizations that have chosen to build their SIEM solution using it, hence why Zenarmor has made it very easy to integrate with.
So let’s create a basic visualization, I am not going to go into a lot of detail about creating dashboards because this process will be unique to your business requirements, however, I can point you in the right direction to get you started.
To start, using the menu on the left, navigate to “Analytics” and then “Visualize Library. You are then going to click “Create New visualization” and select the “Lens” option. There are various other options here and if you are interested in learning more, please have a look at the Elastic documentation.
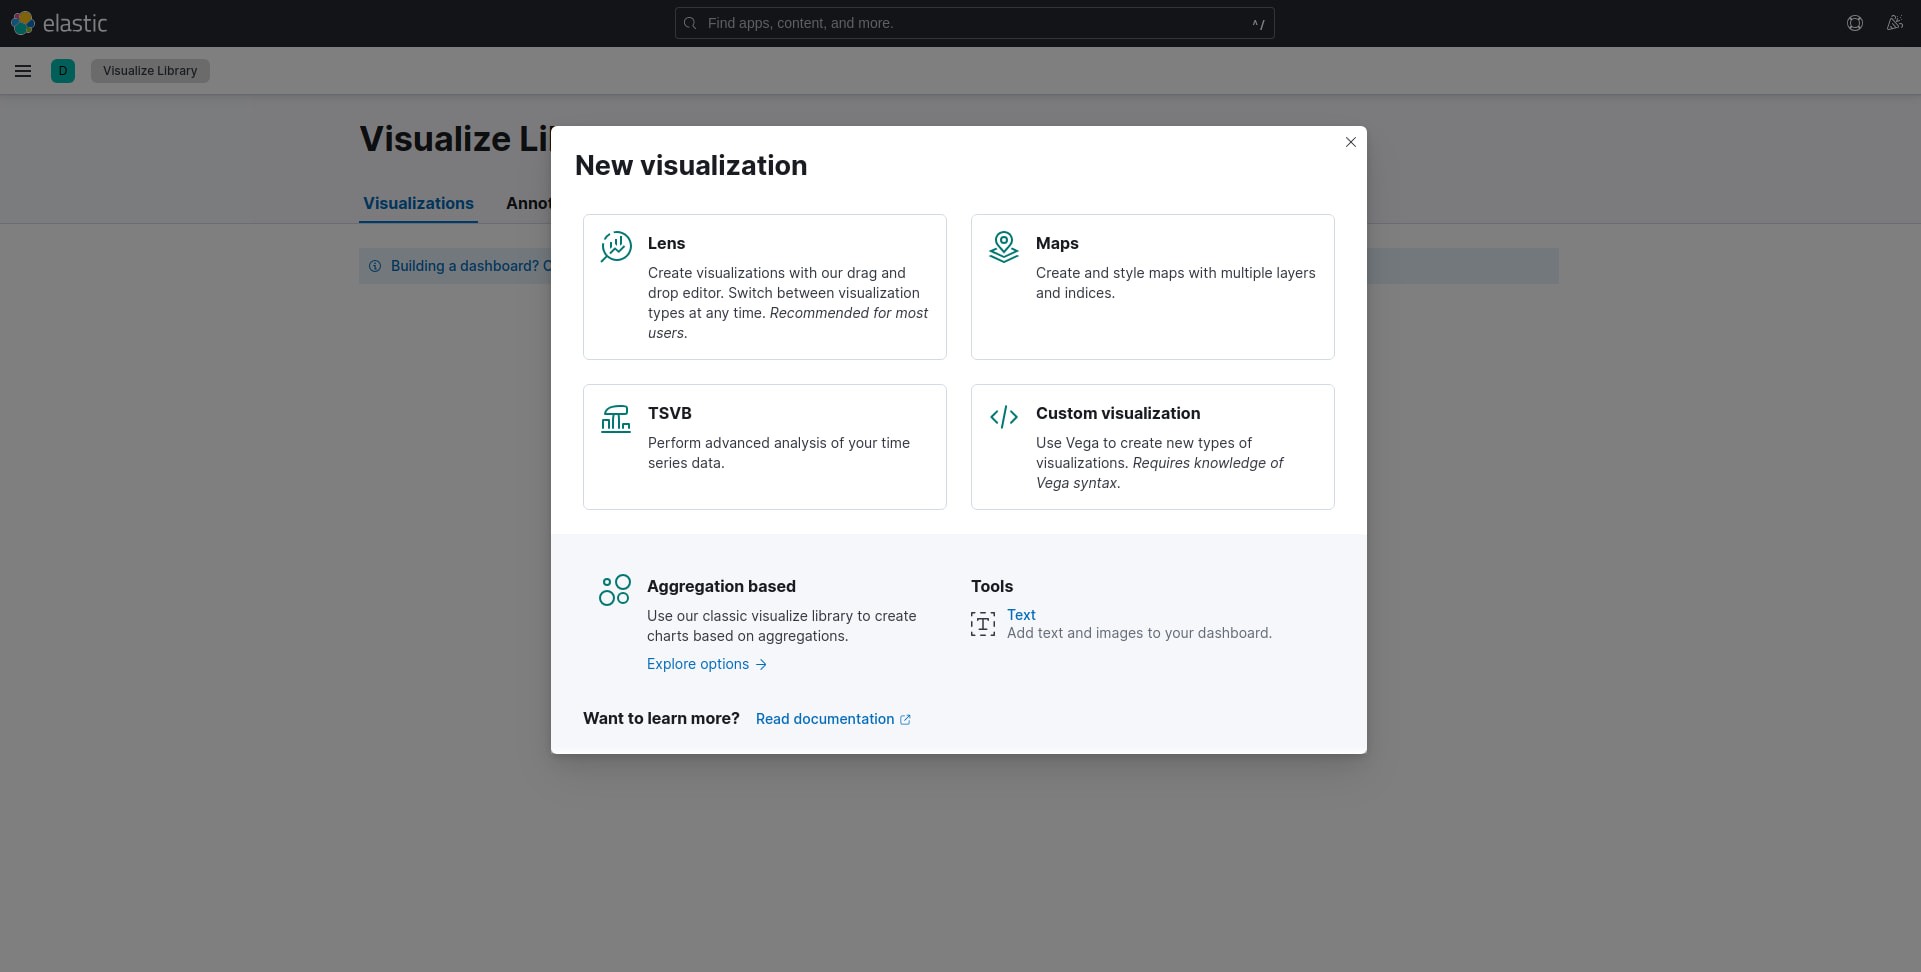
Figure 11: Creating a new Visualization
In the top left, you will need to select the dropdown and choose the data view that we set up in the previous step, in my case it was named “Zen_Conns”. Once selected, all the available fields will be listed to the left.
So let’s create a basic view that contains a donut chart displaying a breakdown of all the application’s network traffic traversing the firewall.
At the top middle, select the chart selection dropdown and scroll down until you see “Donut”. To populate the chart with data, select the “app_name.keyword” field on the left and simply drag it to the middle of the screen, the chart will begin to automatically populate with your data.
From here on feel free to play around with the settings, you can add a legend by selecting the legend button top middle. You can also adjust the “slice by” options to the right, I have set mine to display the top 10 applications. Below is the result of what my visualization looks like, you should have something similar.
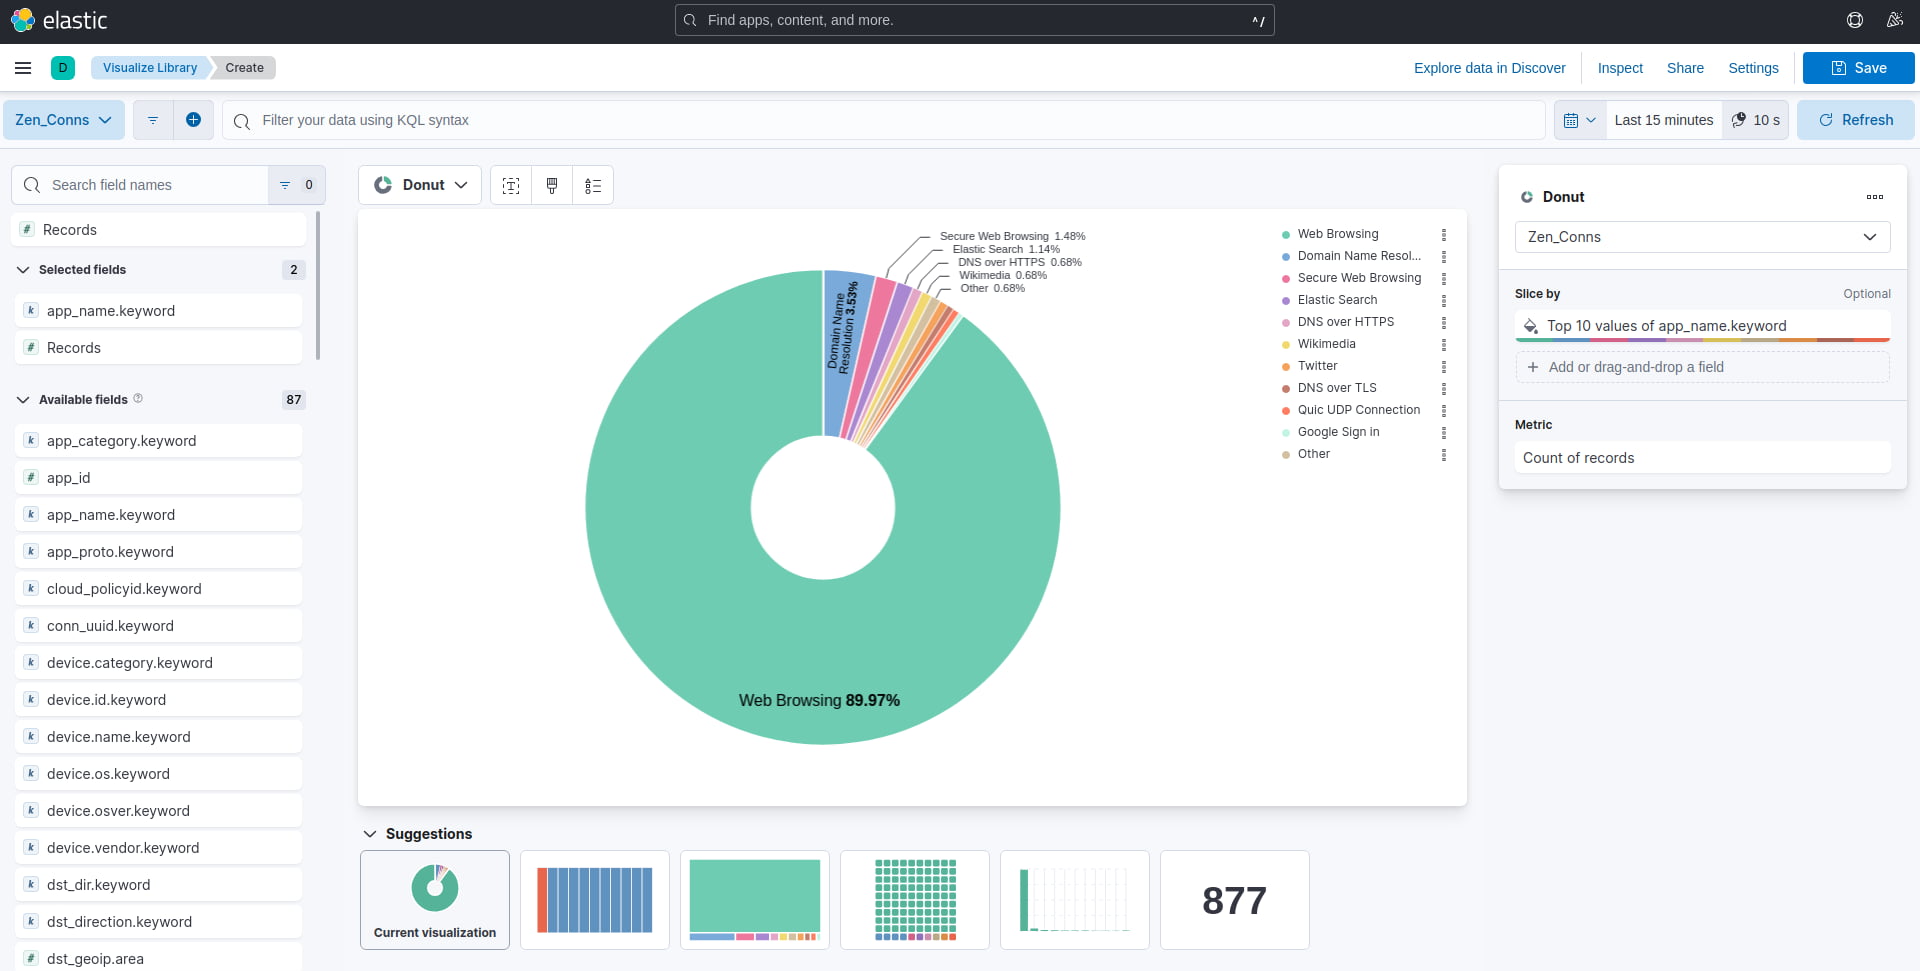
Figure 12: Visualization creation dashboard showing a donut chart displaying the Top 10 most active applications traversing the network as reported by Zenarmor.
Once you have achieved the desired look, simply click the save button, at the top right, and give your new visualization a title and description, from here you can decide if you would like to add it to a dashboard or keep it for later by adding it to your library.

Figure 13: Save Lens visualization menu
From here I encourage you to explore the other available charts and try to create your own unique visualizations.
Some parting thoughts…
You should now be comfortable with integrating Zenarmor with your ELK stack as well as have a solid foundation to build on when it comes to visualizing the data in Kibana logged by Zenarmor.
Zenarmor creates a wealth of accurate and actionable log information while filtering and securing your network traffic which can be of great benefit to analysts operating your SOC, giving them the insight to better detect, investigate, and respond to threats in your environment.
Can you really afford not to be collecting this log data from Zenarmor?
If you are an MSP, MSSP, or business that wants to get the most out of your current Zenarmor and ELK stack deployments, I highly encourage you to try this integration. If you are new to Zenarmor and exploring all its enterprise capabilities you can get started by signing up for a 15-day free trial.