The official release of Zenarmor 1.16 is just around the corner, promising some exciting new capabilities. Today, we will take a sneak peek at one of the new capabilities introduced in this release called Community ID Network Flow Hashing, or Community ID for short.
Community ID is useful in situations where you may need to easily correlate log data between different datasets without the need to create complicated joins between your data. In this article, we are going to show you exactly how to do this by using Community ID to match the network traffic session logs created by Zenarmor with the Sysmon event logs generated on a Windows client in order to build a complete end-to-end picture of a network connection, from the application or process initiating the connection on the Windows client to its final destination endpoint.
Having the ability to pivot quickly between large datasets will give you an edge while analyzing your live network traffic for anomalies during a threat hunt.
So let’s get hunting…
What is Community ID Flow Hashing?
So before we get into the setup, I think it makes sense to briefly explain Community ID and why it was created. Community ID was created as part of a collaboration effort between the Zeek and Suricata communities where there was a need to correlate log data between these two NSM tools without having to create complex joins between the datasets, which can be a tedious process.
Community ID provides a very simple solution to this problem by making use of a cryptographic hash function that is derived from the network connection’s source/destination port, source/destination IP address, seed, and transport protocol (TCP/UDP) which creates a unique identifier for that specific flow of traffic. Because the network connection characteristics (or tuple) remain constant for this traffic flow across the network, the same unique identifier will be derived across multiple systems capturing this traffic flow by making use of the same Community ID hashing function.
These unique identifiers can then be used while correlating log data between these systems to give more context to the flow of traffic. If this does not make complete sense at this stage, don’t worry; after seeing this in action later in the article, it will clear things up for you.
Since the inception of Community ID, it has been integrated into many other security-oriented applications outside of Zeek and Suricata, such as MISP, Security Onion, HELK, Wireshark, Elasticsearch, and now Zenarmor, to name a few.
For this article, we have chosen to use the ELK stack because of its popularity as an SIEM tool, combined with Zenarmor to show you one of the many implementations of Community ID flow hashing.
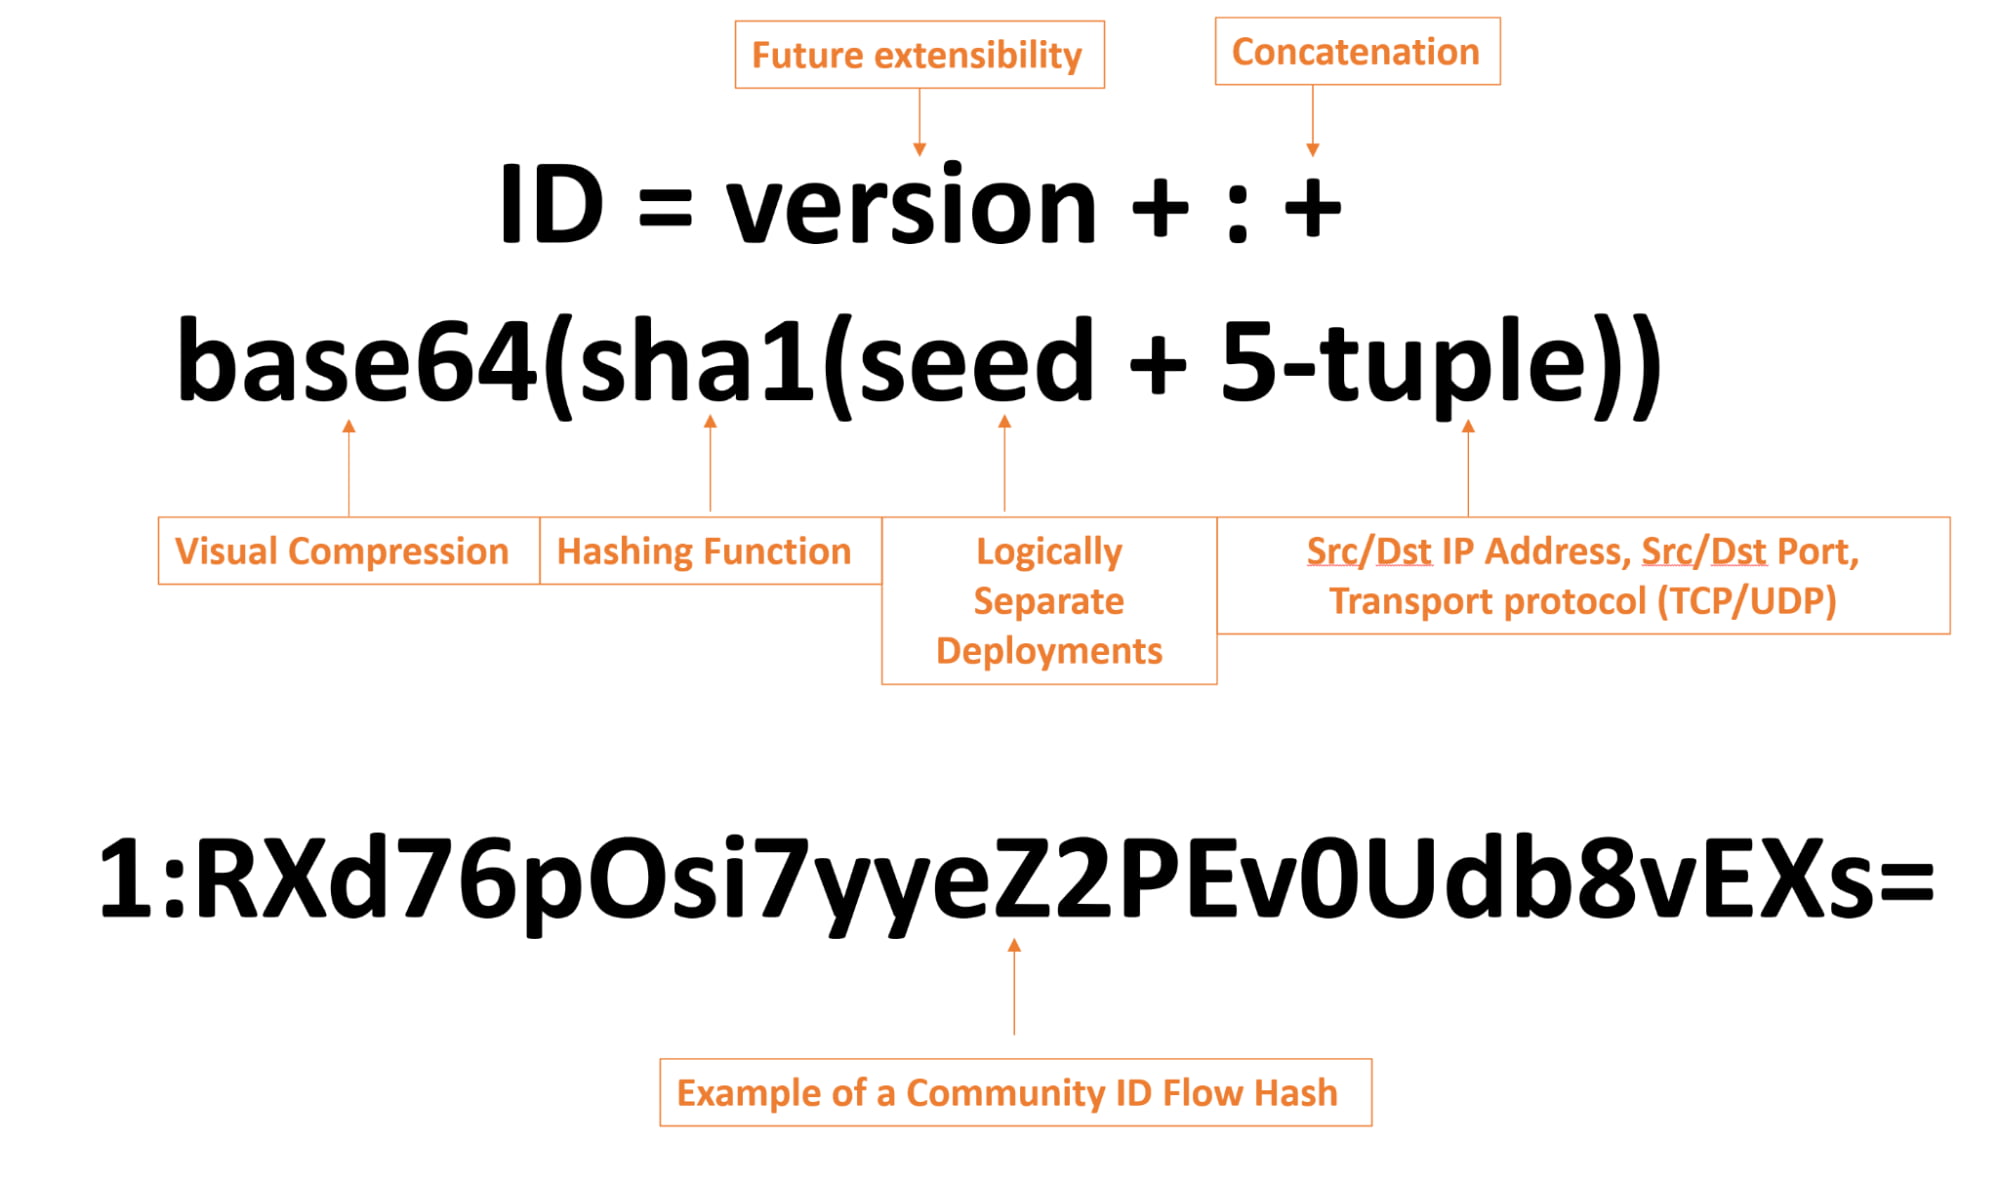
Figure 1: Visual representation of the Community ID hash function and an example of a hash output. Reference
Get Started with Zenarmor Today
Enabling Community ID support in Zenamor
The first part of the setup is to enable Community ID flow hashing in Zenarmor, and like most things Zenarmor-related, it’s a very easy process. Simply head over to the settings menu, and in “Reporting and Data” toggle the Community ID support. That’s all there is to it. Once done, Zenarmor will automatically hash all traffic with the Community ID function, and it will be visible in all reports and logs moving forward.
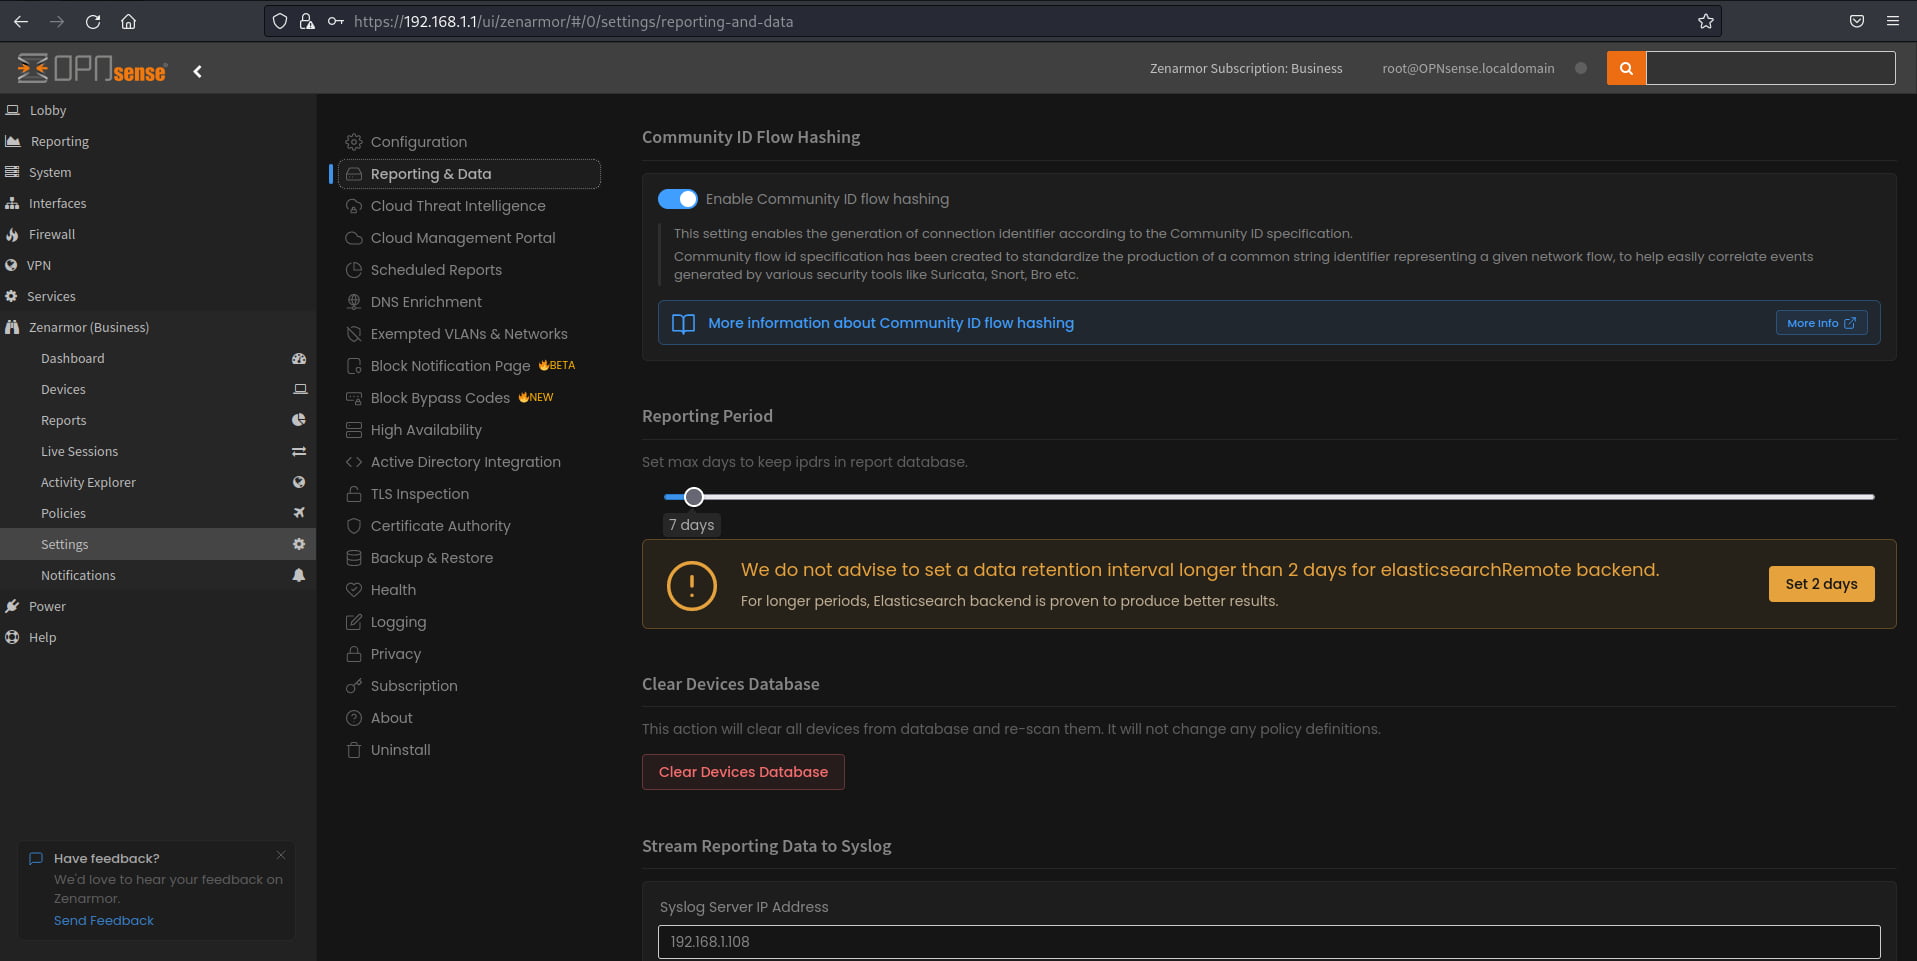
Figure 2: Reporting and Data Settings menu to toggle Community ID support in Zenarmor
Getting your ELK stack ready and enabling a Community ID Pipeline
For this article, we are going to build on a previous article that we created showing how to Integrate Zenarmor with your ELK stack (Elasticsearch, Logstash, and Kibana). We assume from here on that you already have an ELK stack integrated with Zenarmor and that your Zenarmor log data is already indexed in Elasticsearch if you wish to follow along in your own lab environment.
To enable Community ID support in the ELK stack, we need to set up an ingest pipeline that makes use of the already built-in Community ID processor to filter and match the network connection tuple in the log data, originating from the Sysmon event log, that is streamed to ELK using the Winlogbeat agent that we will configure later.
Once the Sysmon event log data is processed by the Community ID processor, a new Community ID field will be inserted into the indexed log data with a newly generated Community ID hash similar to what we showed in the image above.
To create the ingest pipeline, navigate to the stack management menu in Kibana and then select “Ingest Pipeline”. You will need to give your pipeline a name and description. Under the processors option, you will need to “add a processor” and select the “Community ID” processor from the drop-down.
You will notice that you have the option to override the default field values for your Community ID processor, which in the case of this tutorial is necessary because the Winlogbeat agent uses different field names for the Community ID processor’s defaults. This means that if we don’t use the Winlogbeat field names, the data will fail to be processed, and no Community ID hash will be generated.
To make it easy for you, we have mapped the field names we used in the below table:
| Source IP | winlog.event_data.SourceIp |
| Source Port | winlog.event_data.SourcePort |
| Destination IP | winlog.event_data.DestinationIp |
| Destination Port | winlog.event_data.DestinationPort |
| Transport | winlog.event_data.Protocol |
| Target Field | community_id |
The other options are optional and can be ignored. Once done, you can save everything, and your pipeline will be active.
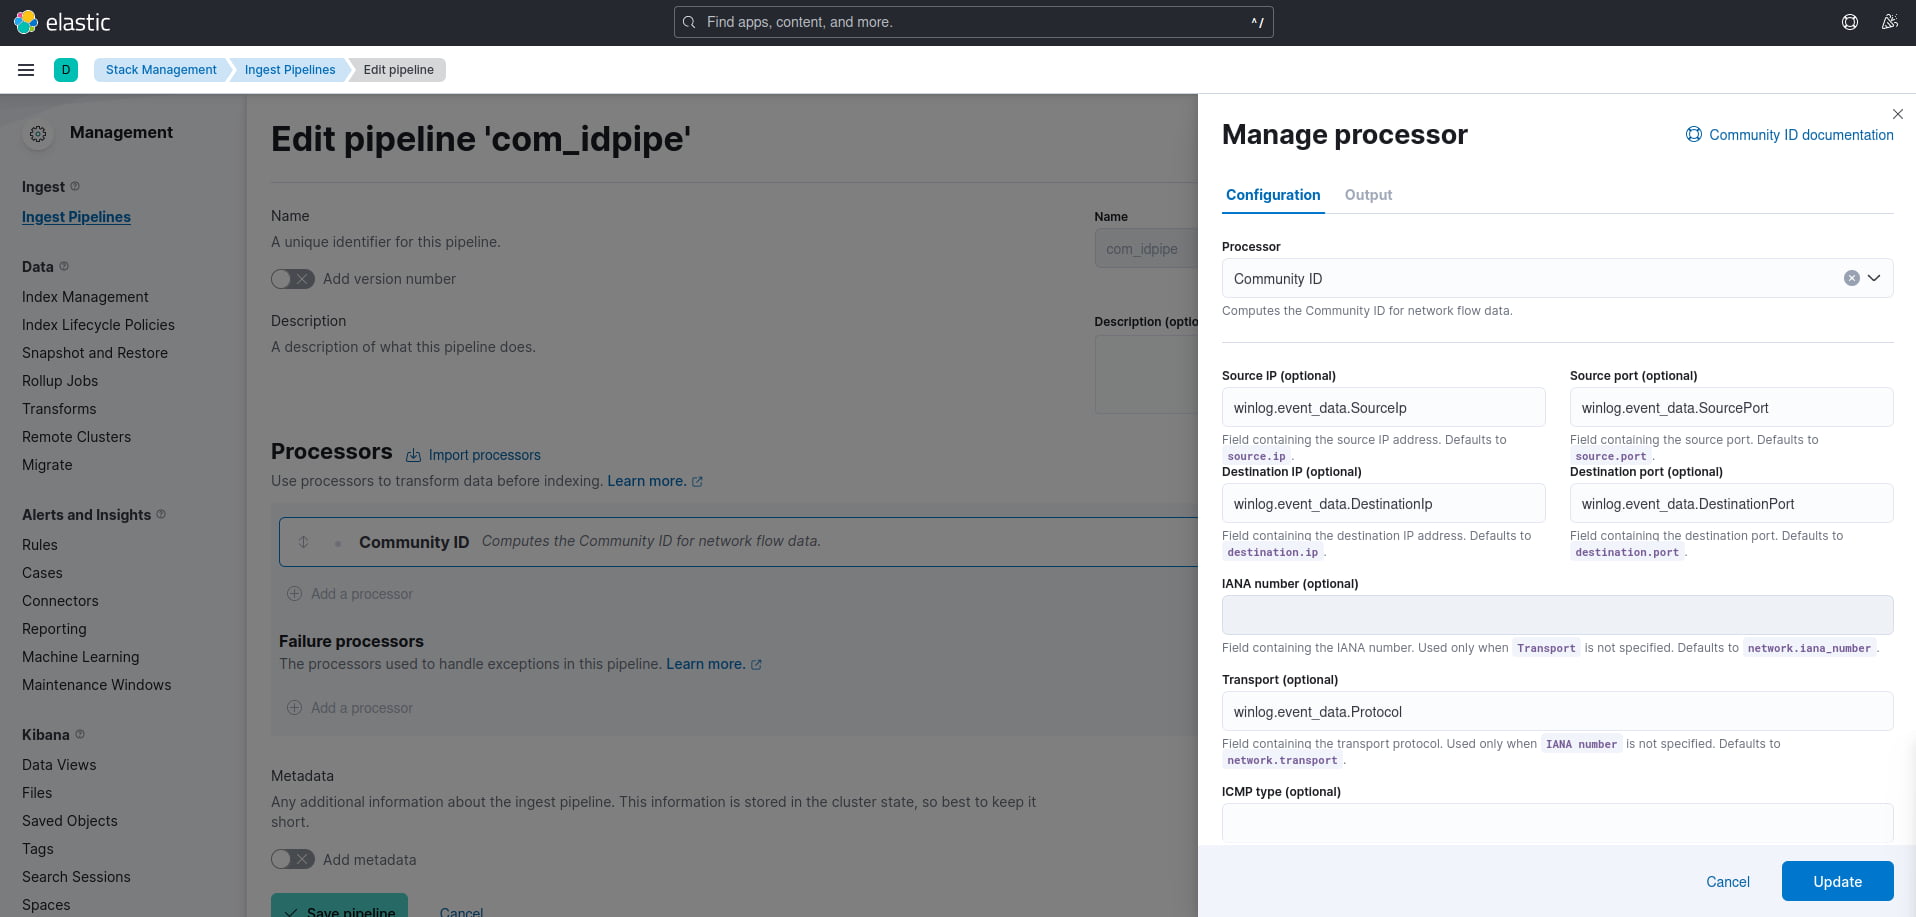
Figure 3: Completed ingest pipeline and processor setup with the overridden field names
Setting up the Winlogbeat Agent and Sysmon on your Windows 11 client
Now that the ingest pipeline is ready to process the log data, we need to ship the log data from our Windows 11 client using Winlogbeat. To install Winlogbeat, simply download the Wonlogbeat agent and unzip it into your Program Files folder.
You will then need to open a PowerShell prompt as an administrator and run the below command to install the Winlogbeat agent:
.\install-service-winlogbeat.ps1
The output should be similar to this:
PS C:\Users\Administrator> cd 'C:\Program Files\Winlogbeat'
PS C:\Program Files\Winlogbeat> .\install-service-winlogbeat.ps1

Security warning
Run only scripts that you trust. While scripts from the internet can be useful,
this script can potentially harm your computer. If you trust this script, use
the Unblock-File cmdlet to allow the script to run without this warning message.
Do you want to run C:\Program Files\Winlogbeat\install-service-winlogbeat.ps1?
[D] Do not run  [R] Run once  [S] Suspend  [?] Help (default is "D"): R

Status   Name               DisplayName
------   ----               -----------
Stopped  winlogbeat         winlogbeat
If you run into issues with script execution being disabled on your system, you can use the following command to override this:
PowerShell.exe -ExecutionPolicy UnRestricted -File .\install-service-winlogbeat.ps1
To configure Winlogbeat, you will need to use the winlogbeat.yml file in the same location that you unzipped the agent to. This .yml config is fairly large, so I have highlighted the changes I made, with comments, to the config below:
winlogbeat.event_logs:
- name: Application
    ignore_older: 72h

- name: System

- name: Security

- name: ForwardedEvents
    tags: [forwarded]

- name: Windows PowerShell
    event_id: 400, 403, 600, 800

- name: Microsoft-Windows-PowerShell/Operational
    event_id: 4103, 4104, 4105, 4106

    #Add this to include the Sysmon logs
    - name: Microsoft-windows-sysmon/operational
        tags: [sysmon]
# ---------------------------- Elasticsearch Output ----------------------------
    output.elasticsearch:
    # Point to your Elasticsearch instance, change the pipeline here to whatever you named yours in the previous step
    hosts: ["192.168.1.104:9200"]
    pipeline: com_idpipe

    # Protocol - either `http` (default) or `https`.
    #protocol: "https"

    # Authentication credentials - either API key or username/password, I have disabled security  completely for my ELK lab environment, however, if this is for production environments you will need to supply an API key/Username/Password
    #api_key: "id:api_key"
    #username: "xxxxx"
    #password: "xxxxx"
Once your configuration is done, you can validate it using the below command. It should return no errors if all is correct:
PS C:\Program Files\Winlogbeat> .\winlogbeat.exe test config -c .\winlogbeat.yml -e
If all goes well, you can start the service using the following command:
PS C:\Program Files\Winlogbeat> Start-Service winlogbeat
Simply download Sysmon and extract it into Program Files, if you don’t already have Sysmon installed.
To activate the service, in our case, we simply ran the below command that installs Sysmon and points it to a config-sys.xml file, which you will need in order to enable the logging of network connections, as it is disabled by default. Syslog no longer supports the -n parameter which was used to enable logging of all network connections. More information can be found in the documentation.
sysmon -accepteula -i c:\windows\config-sys.xml
Our config-sys.xml is as follows: We created a rule to match any destination port between 1 and 65535 to catch all network connections. In a production environment, you will probably want to fine-tune this to match specific ports and applications to avoid creating unnecessary logs.
<Sysmon schemaversion="4.90">
    <!-- Capture all hashes -->
    <HashAlgorithms>*</HashAlgorithms>
    <EventFiltering>
        <RuleGroup groupRelation="and">
        <NetworkConnect onmatch="include">
        <DestinationPort condition="more than">1</DestinationPort>
        <DestinationPort condition="less than">65536</DestinationPort>
        </NetworkConnect>
    </RuleGroup>
    </EventFiltering>
</Sysmon>
If all went well, you should see Sysmon logs appearing in Kibana under the Discover dashboard. To view your Zenarmor indexed data, refer to step 4 of the Integrate Zenarmor with your ELK stack (Elasticsearch, Logstash, and Kibana) article, where we show you how to set up a data view.
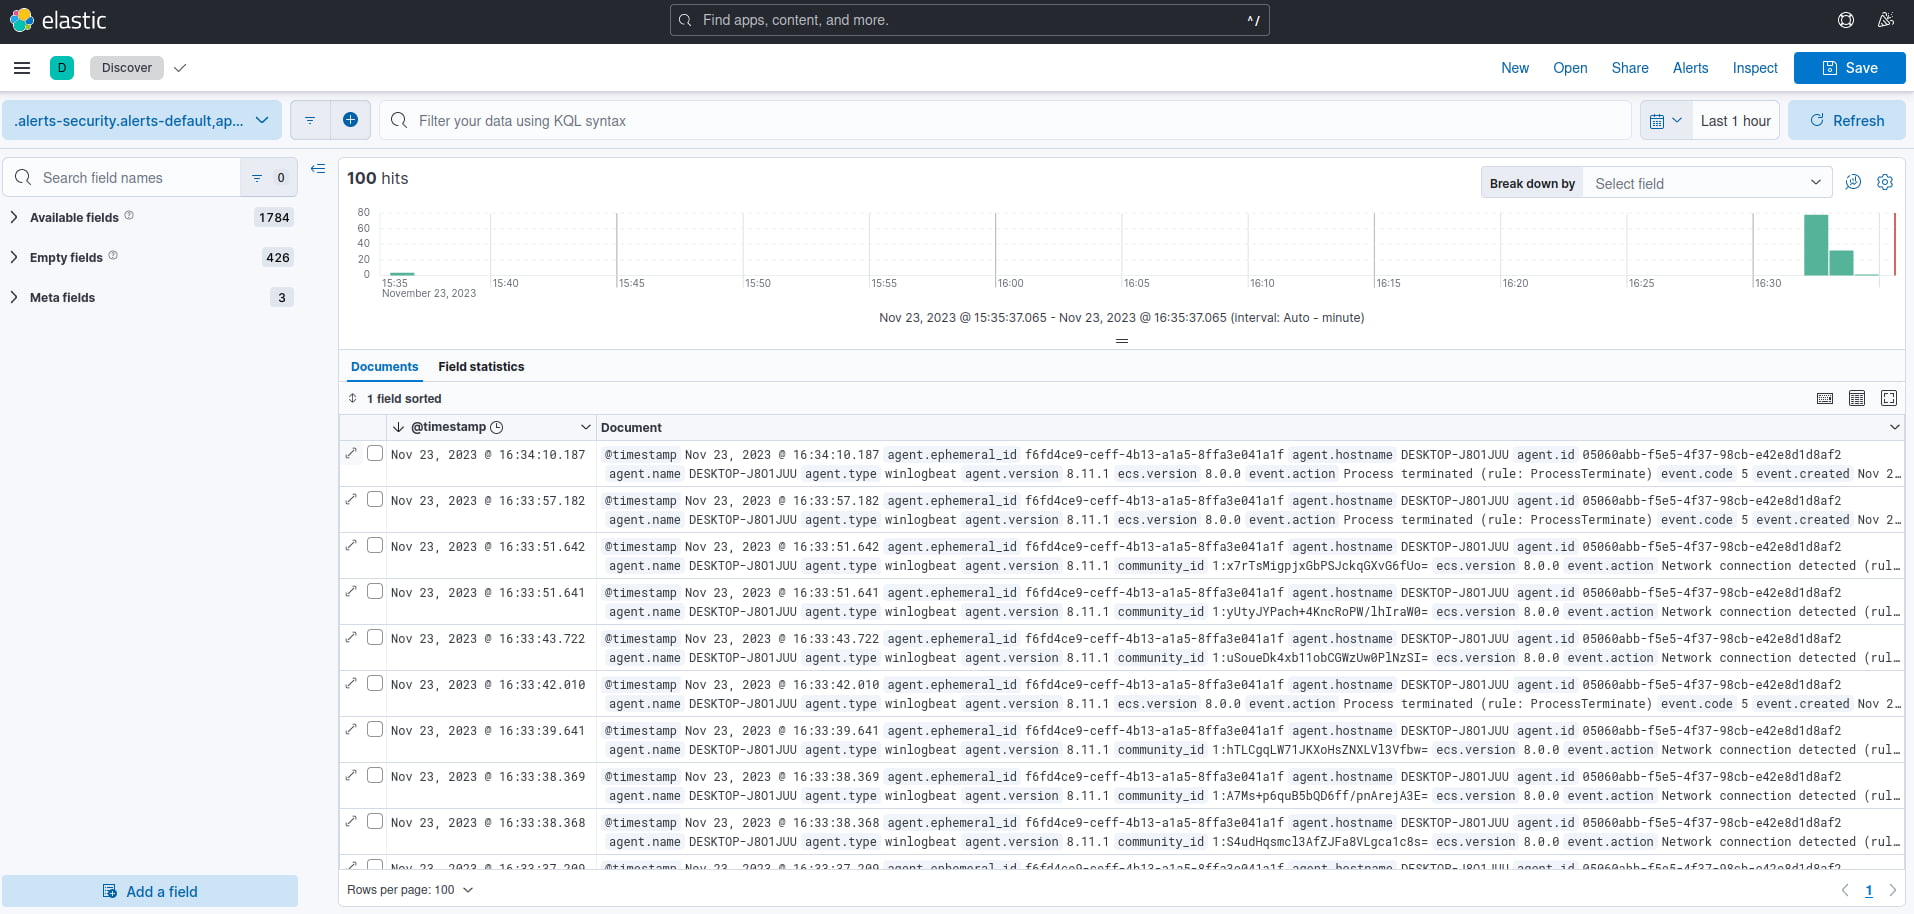
Figure 4: Kibana Discover dashboard showing ingested Sysmon logs from the Windows 11 client.
Visualizing and Correlating the log data with a simple Kibana dashboard
In order to visualize and begin correlating the Zenarmor and Sysmon log data, we created a very simple dashboard, as seen below. We are not going to detail the dashboard creation process because there is plenty of documentation online to help you with this, but in a nutshell, we created and saved two searches using the Discover dashboard for each dataset. We then added the saved searches as tables to the security dashboard, filtered out the unwanted data, and pinned the columns in which we were interested, as seen below.
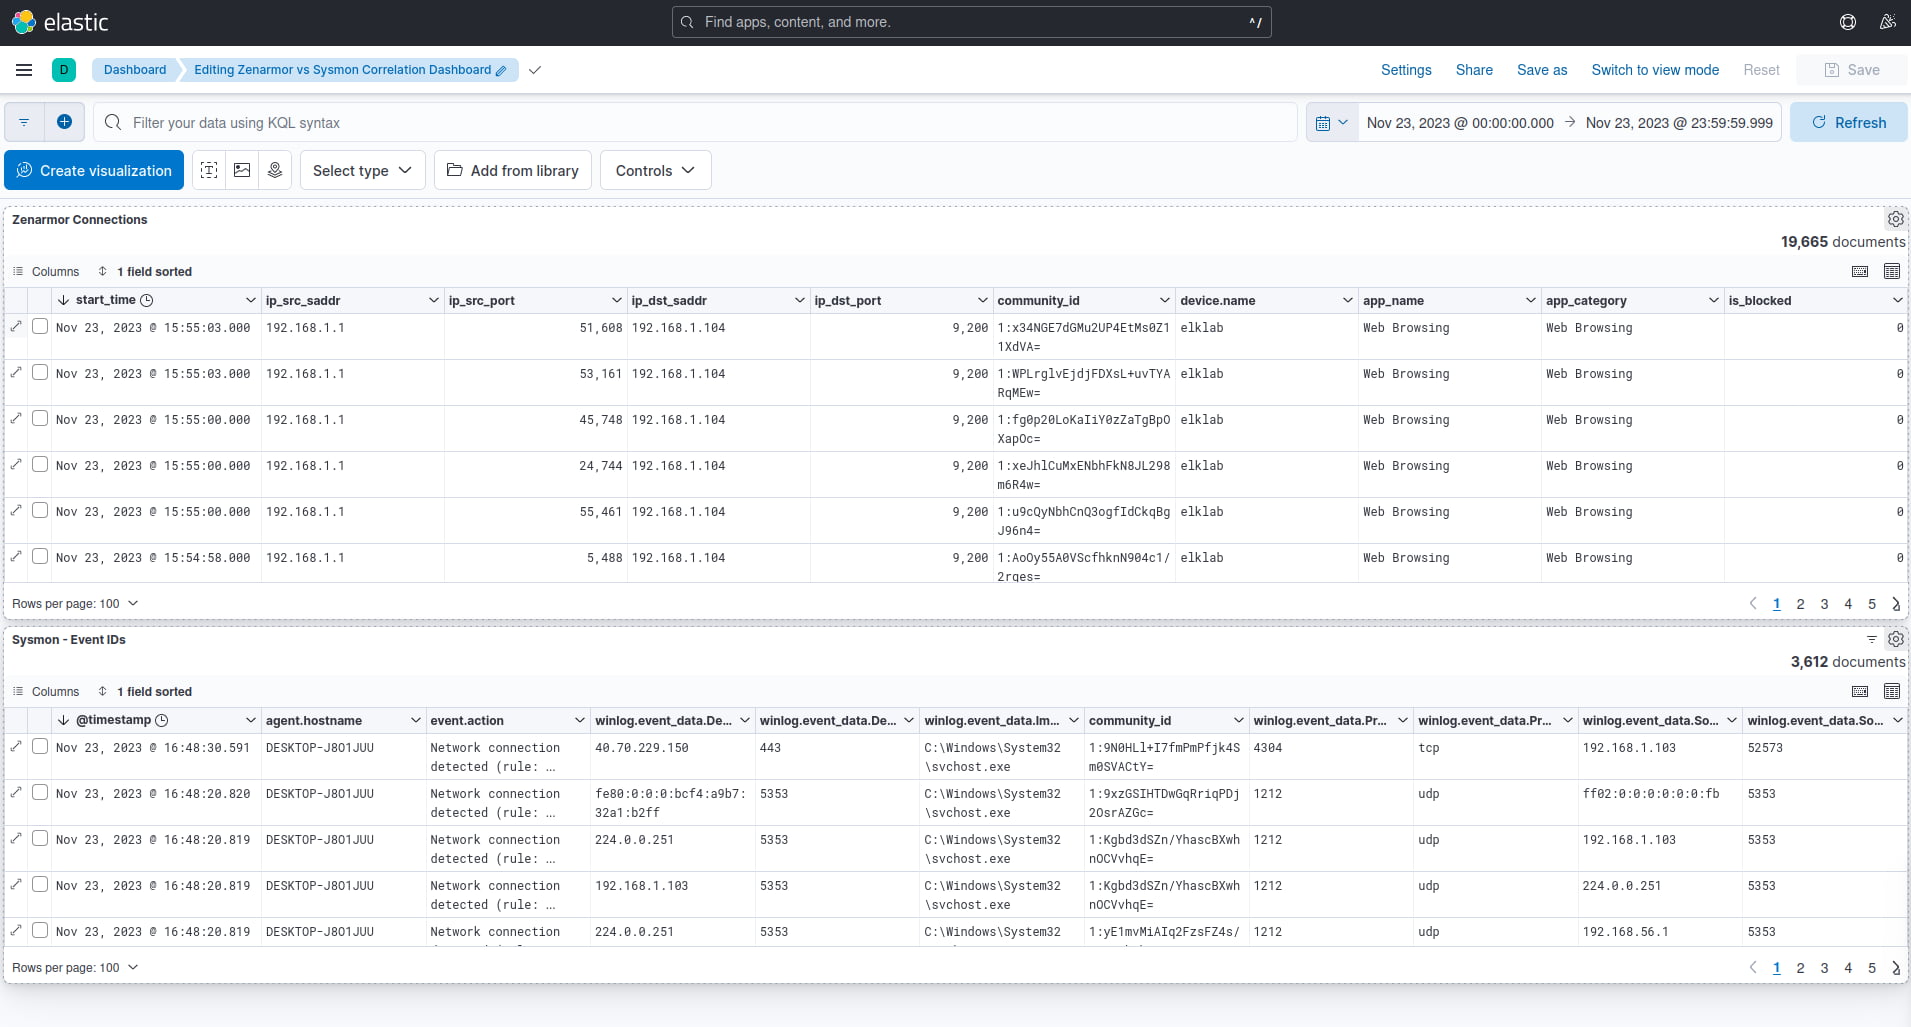
Figure 5: Custom Kibana dashboard showing both Zenarmor and Sysmon log datasets in tabular form
Basically, the first table is all the Zenarmor connection or session data with fields such as source and destination IP and ports, the device initiating the connection, app name, and category, as well as the community_id fields.
Below that, we have a similar table for the Sysmon log data, once again filtering for source and destination IPs and ports, process IDs, process names, and community_id fields.
So now that our data is side by side, let’s simulate a very basic threat-hunting exercise to demonstrate how Community ID can be used to correlate log data. Let’s start by examining the Sysmon logs for interesting or suspicious-looking process names by looking through the Image Paths in the “winlog.event_data.Image” column of the table.
For the sake of this demo, we found a network connection initiated by the “taskhostw.exe” process, which is responsible for executing DLL activities in the Windows operating system. If we just look at the Sysmon log, as seen below, we can see that the process established a network connection to 20.44.239.154 using port 443/HTTPS, however, there is very little context from this point of view on what or who the process is actually communicating with at that address.
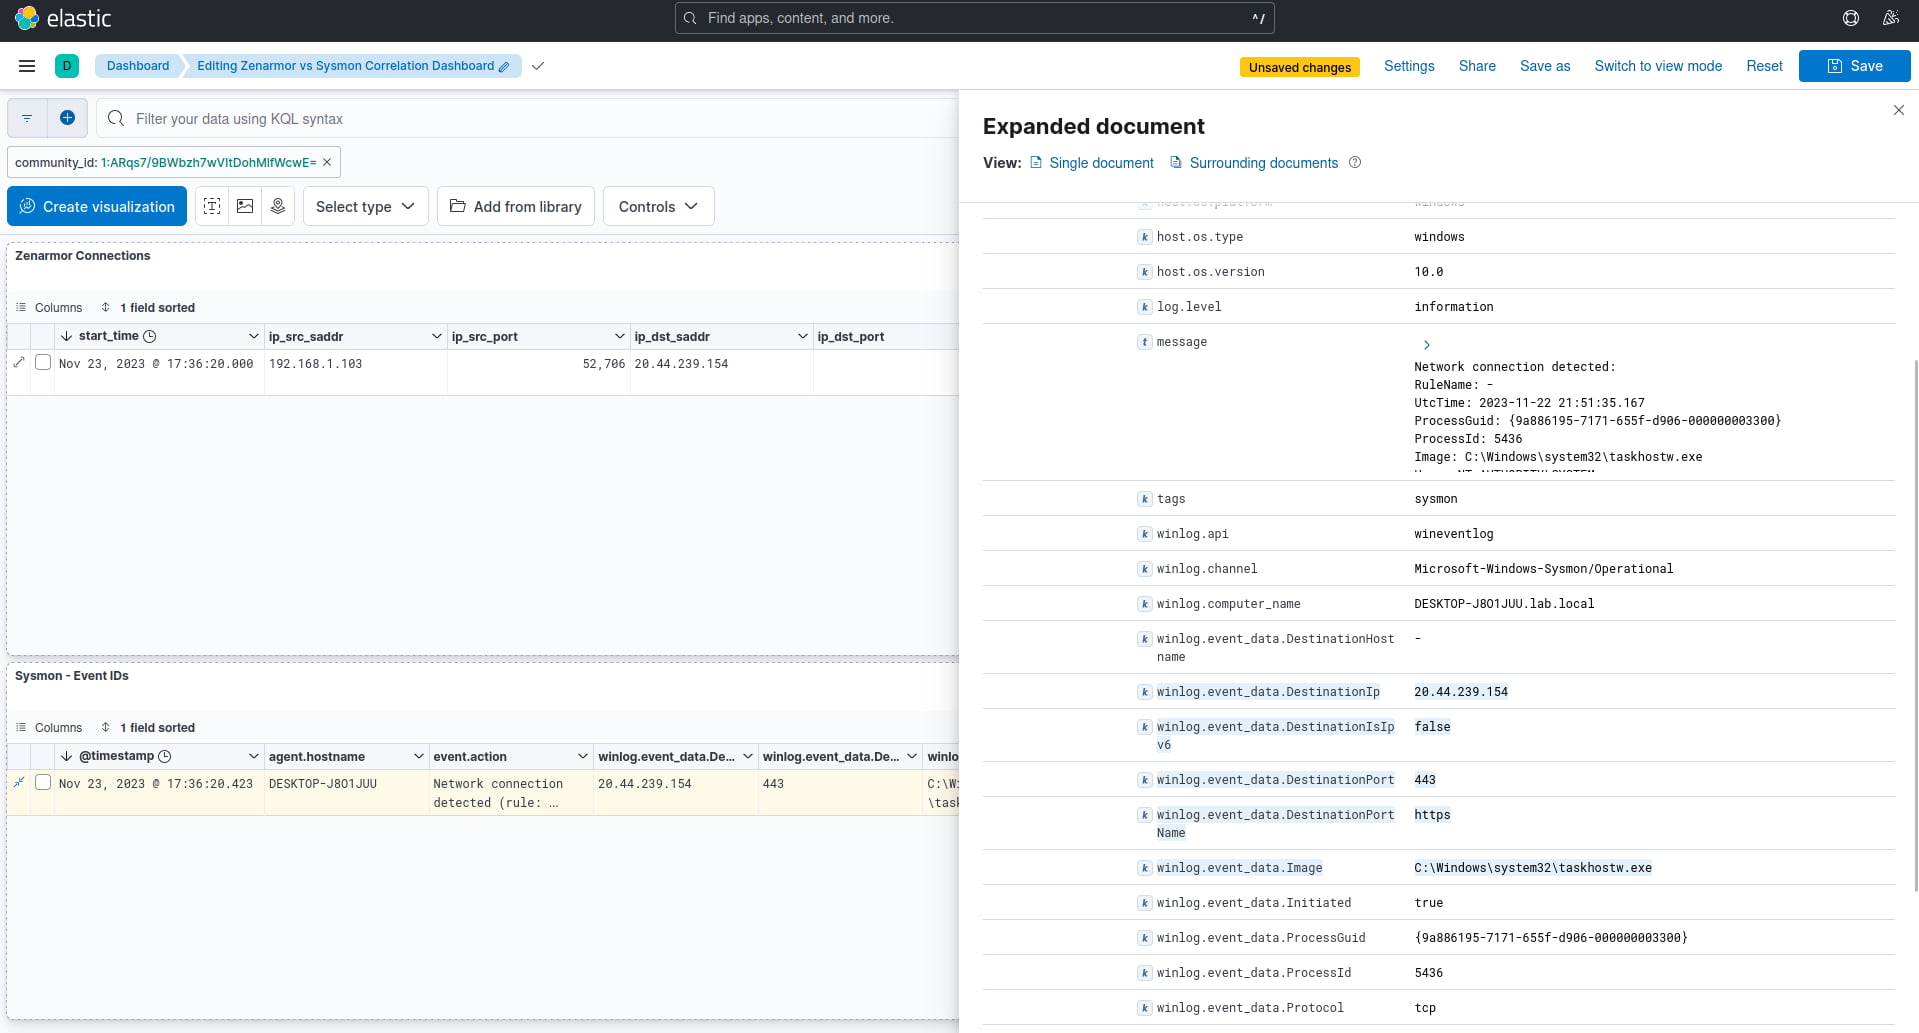
Figure 6: Exploring the Sysmon event for the taskhostw.exe process and suspicious network connection to 20.44.239.154
We then filtered using the events community_id 1:ARqs7/9BWbzh7wVItDohMlfWcwE= that was generated by the Community ID ingest pipeline that we set up earlier, and as expected, it matched up with the corresponding network connection captured by Zenarmor, as seen below.
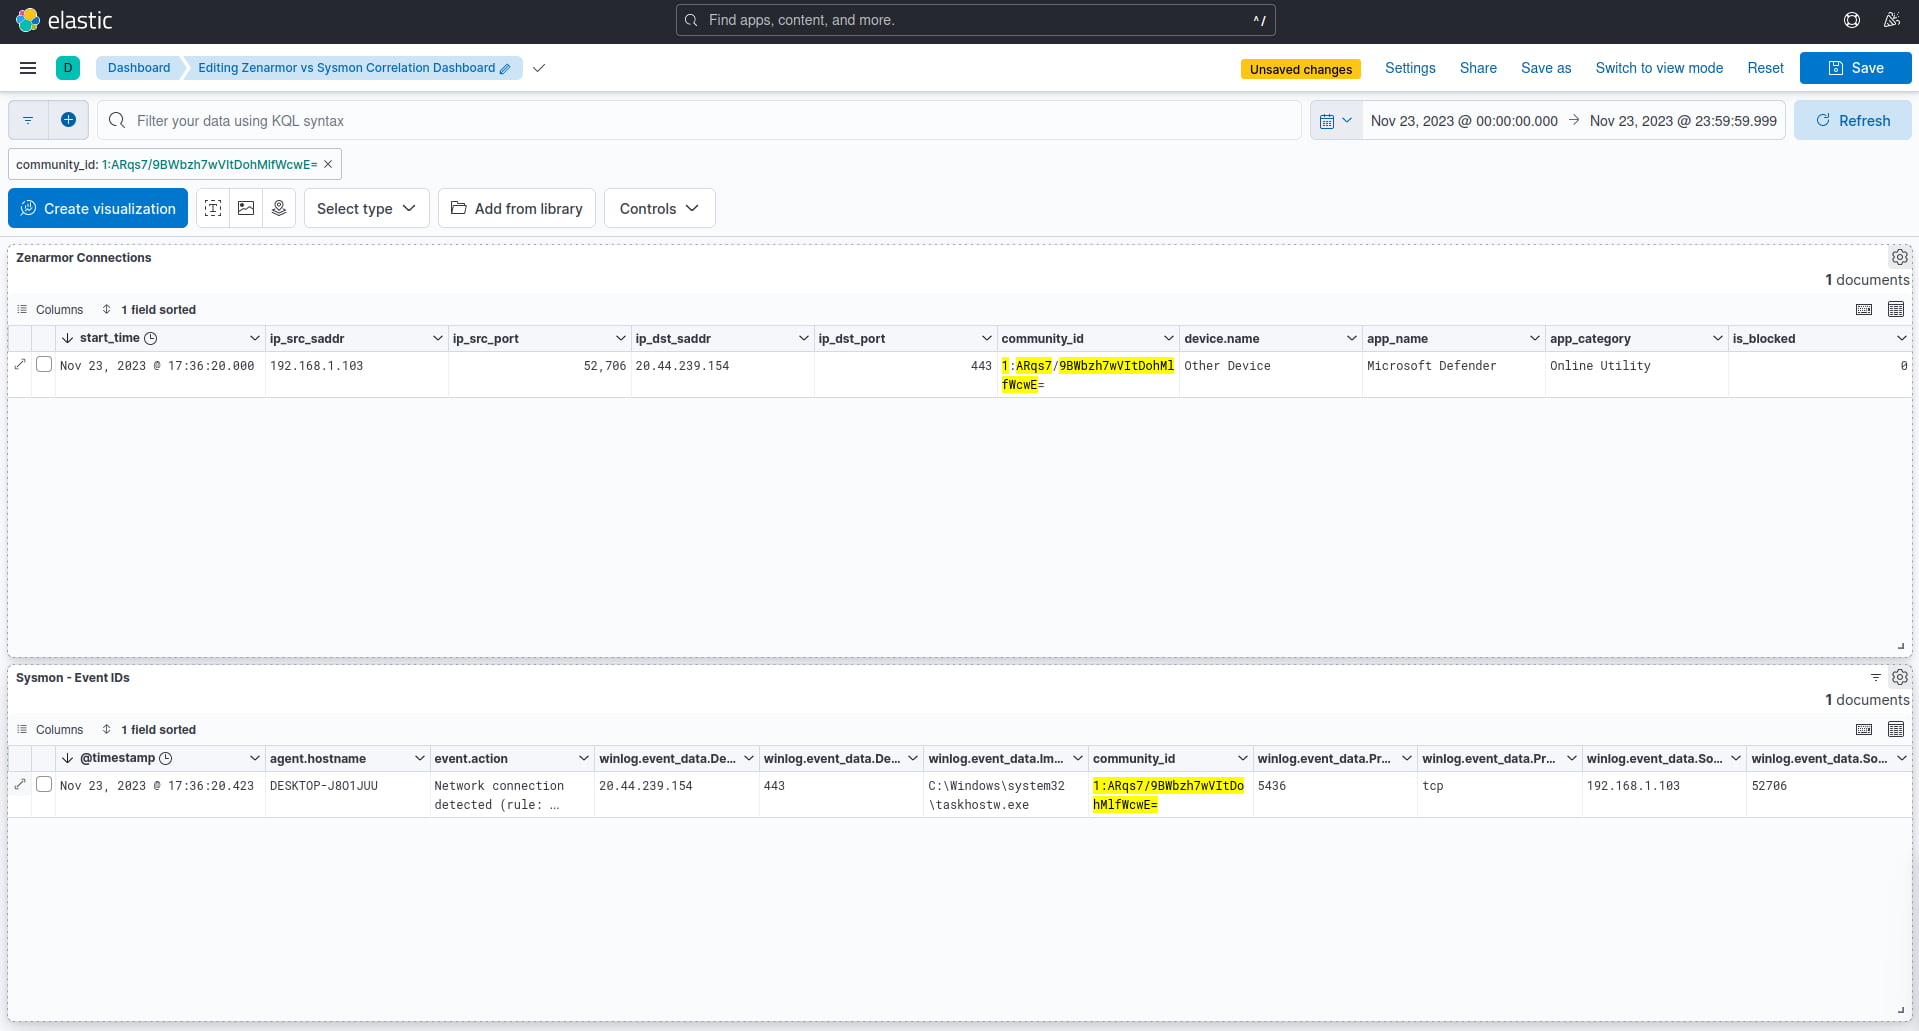
Figure 7: Correlation of network connection data found in both the Zenarmor and Sysmon datasets by matching on the Community ID
As a result of correlating the two datasets using the Community ID, we can immediately see further context about the network connection in question. Zenarmor has identified this application as Microsoft Defender; we can see the location of the GeoIP is in Singapore, and we can also see the destination hostname as “settings-win.data.microsoft.com”.
We now have full end-to-end visibility, starting with the process that initiated the connection on the Windows client to the final destination endpoint in Singapore, and through this analysis, we can determine that this does not appear to be a threat in this case and is probably a Microsoft Defender update originating from a trusted microsoft.com domain.
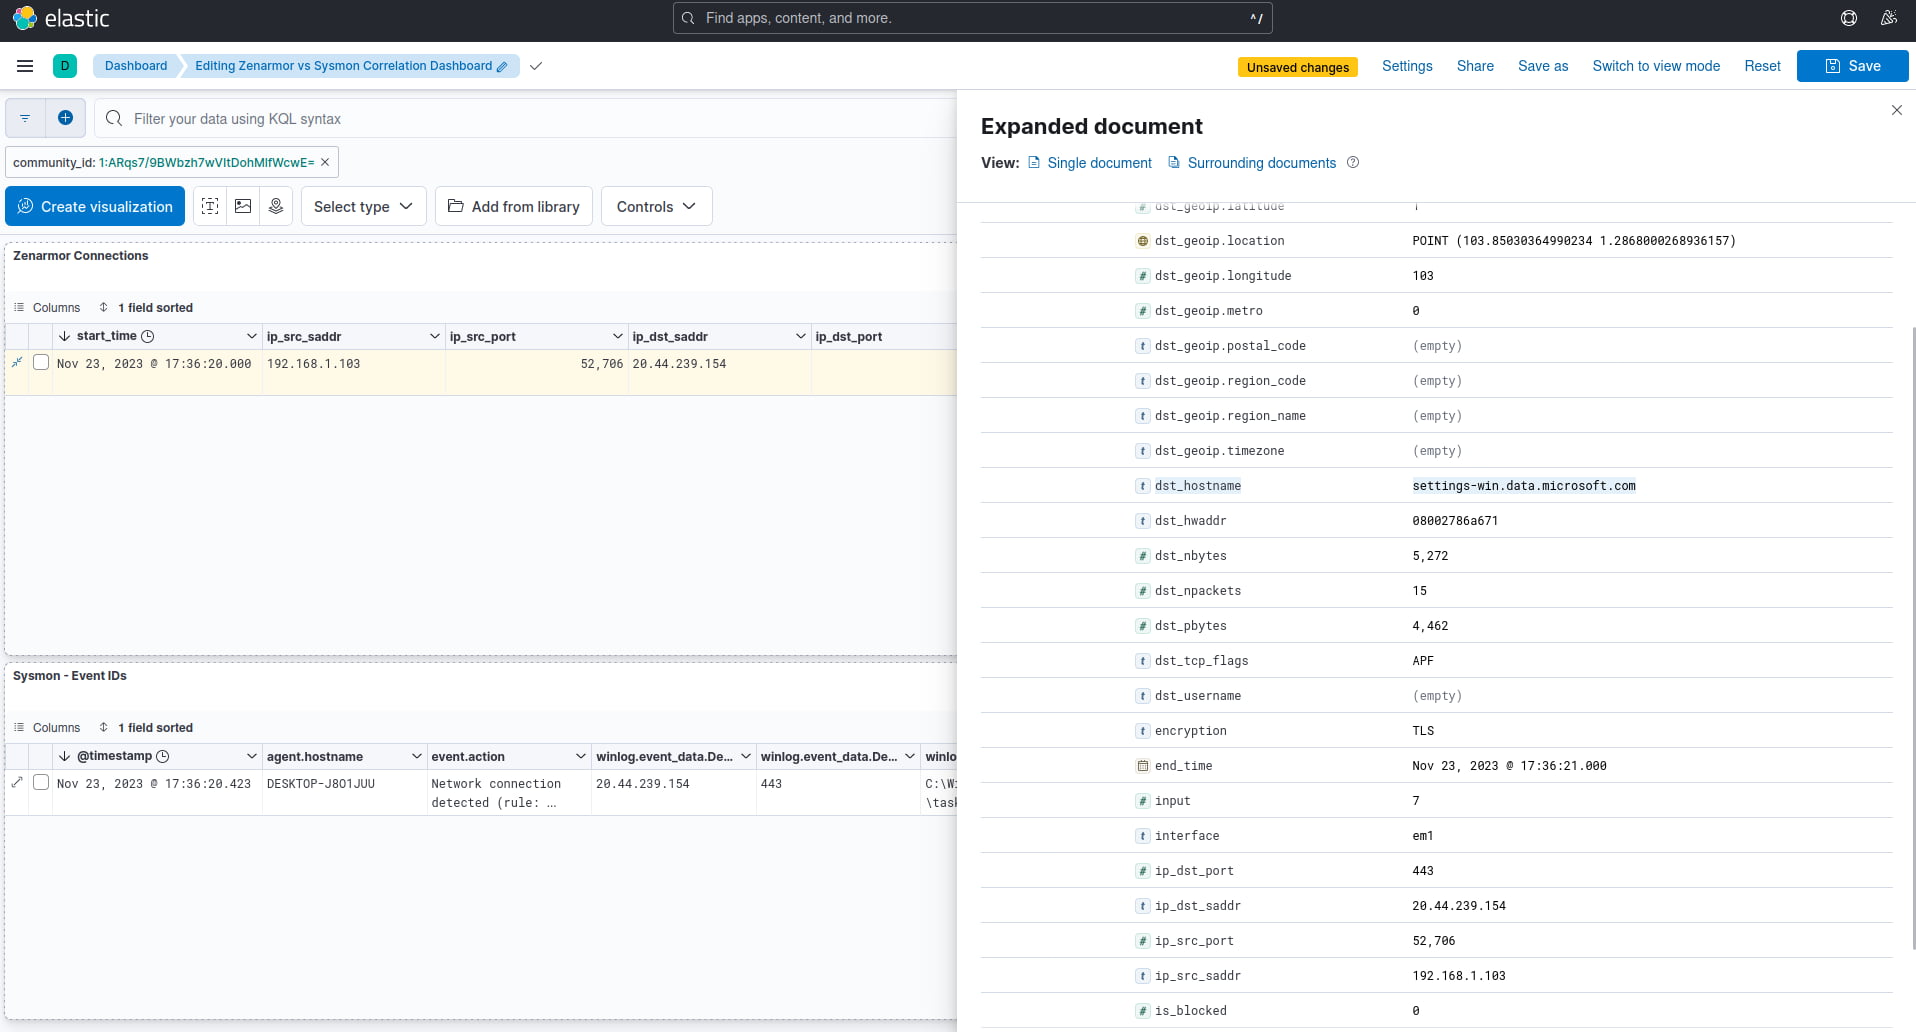
Figures 8 and 9: Examining the log data generated by Zenarmor, the application has been classified as Microsoft Defender, as well as the location and domain name information, which is useful when trying to establish the purpose of the network connection.
This very same methodology that we just followed can be repeated with any Windows process, and it should be pretty clear by now that by using Community ID Network Flow Hashing combined with solutions like Zenarmor and ELK to correlate log data between these different datasets, we can create a very powerful and insightful means to hunt for potential threats traversing our networks.
Wrapping things up…
Zenarmor creates a wealth of accurate and actionable log information while filtering and securing your network traffic, which can be of great benefit to analysts or threat hunters operating your SOC, giving them the insight to better detect, investigate, and respond to threats in your environment, now with the ability to leverage the power of Community ID.
Can you really afford not to be collecting this log data from Zenarmor?
If you are an MSP, MSSP, or business that wants to get the most out of your current Zenarmor and ELK stack deployments, we highly encourage you to try this integration. If you are new to Zenarmor and are exploring all its enterprise capabilities, you can get started by signing up for a 15-day free trial.